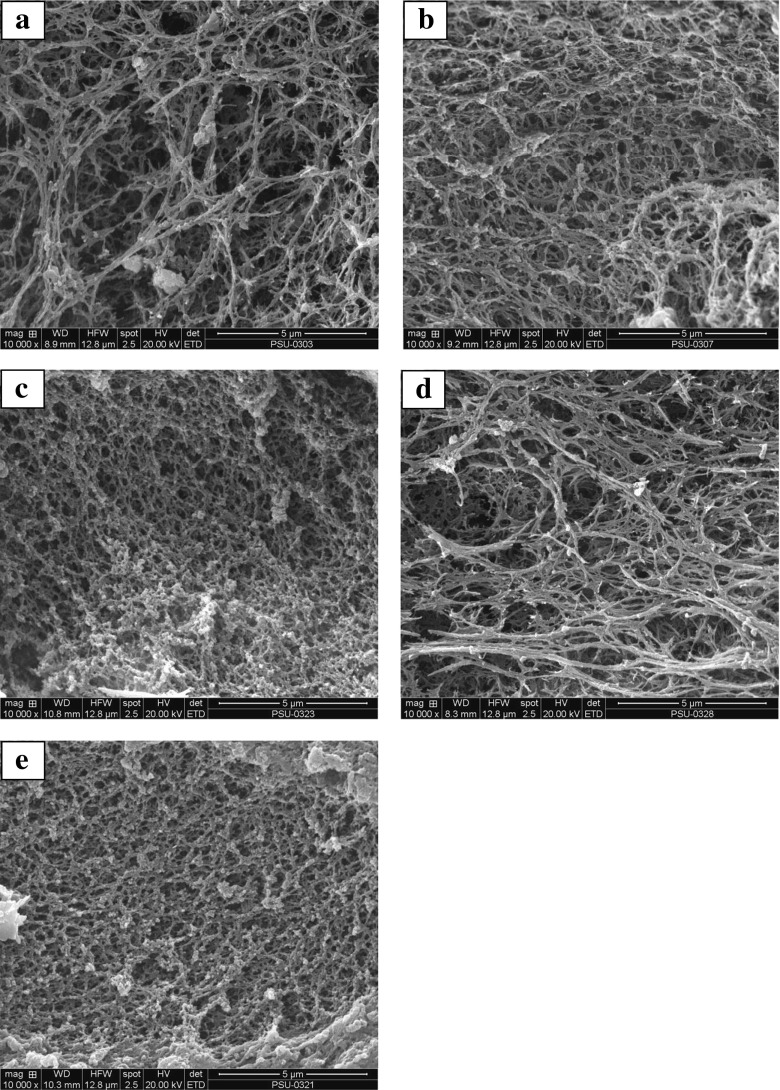
Fig. 4.
Scanning electron microscopic images of gel from sardine surimi without and with different SIT/TA mixtures having different reaction times. a: Control (without SIT/TA mixture); b: 0.5 % TA, 500U SIT/g, 90 min; c: 0.5 % TA, 500 U SIT/g, 180 min; d: 1 % TA, 300 U SIT/g, 180 min; e: 1 % TA, 500 U SIT/g, 90 min. Magnification: ×10,000

