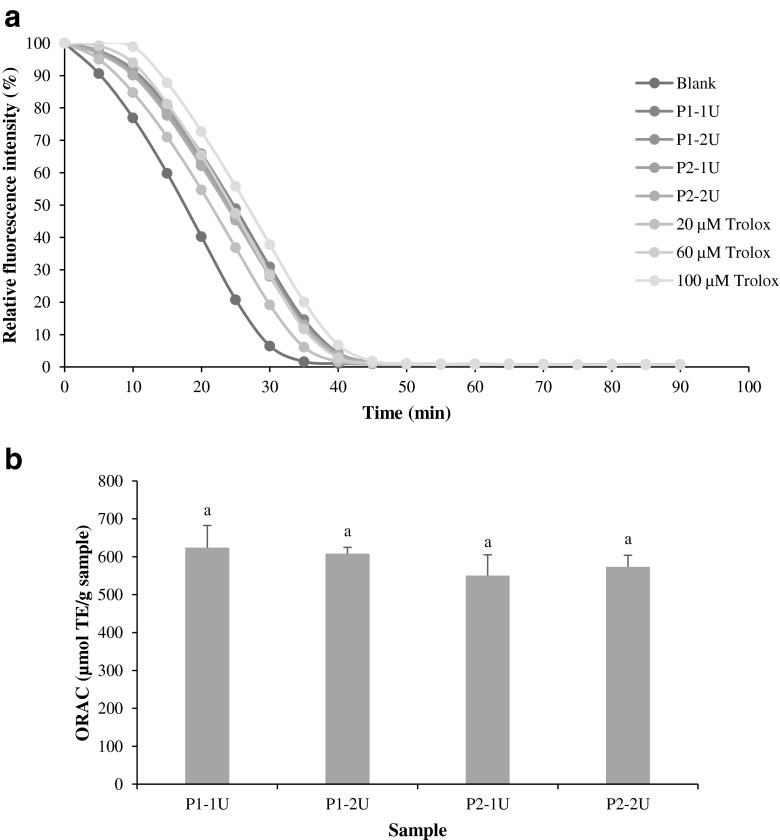
Fig. 2.
Fluorescence decay curves of fluorescein (a) and oxygen radical absorbance capacity (ORAC) of gelatin hydrolysates (b). Bars represent the mean ± standard deviation (n = 3). Different letters on the bars indicate significant differences (p < 0.05), ANOVA followed by Tukey’s. P1-1U and P1-2U represent gelatin hydrolysate produced during gelatin extraction with enzyme concentrations of 1 and 2 units/g dry swollen skin, respectively. P2-1U and P2-2U represent gelatin hydrolysate produced after gelatin extraction with enzyme concentrations of 1 and 2 units/g dry swollen skin, respectively

