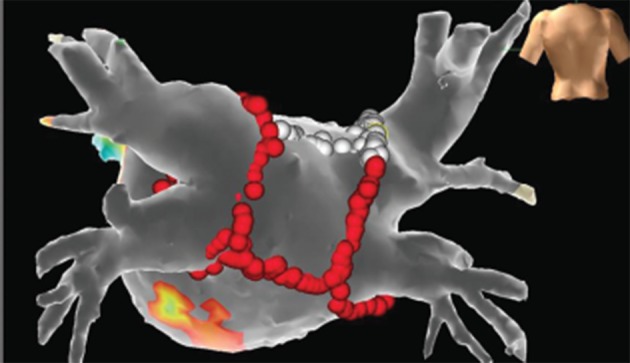
Figure 1: Voltage Map of the Left Atrium During a Repeat Procedure of Atrial Fibrillation Ablation.

All voltage and ablation points are projected on the segmented computed tomography (CT) model of the left atrium after fusion of the electroanatomical model with the help of OneModel® Module of the EnSite Velocity® system. Red points correspond to ablation lines. White points correspond to areas where pacing over the ablation catheter resulted in no atrium capture, helping us to avoid unnecessary ablation. Purple areas depict zones of the atrium with voltage amplitude >0.5 mV. Grey areas depict zones of voltage <0.2 mV. Other colours correspond to intermediate amplitude voltage zones. In this case, after re-isolation of the pulmonary veins, completion of an already existing box lesion at the antrum of the left atrium was conducted.
