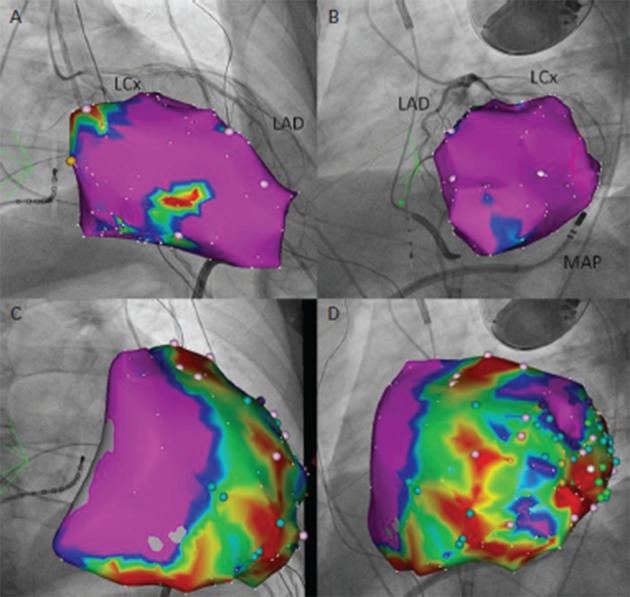
Figure 3: Pace Mapping of a Ventricular Premature Beat Utilising the PaSo® Module of CARTO® System.

A. Right anterior oblique (RAO) view of an electroanatomical model of the left ventricle during endocardial voltage mapping. Purple areas correspond to voltage amplitude >1.5 mV, whereas blue to yellow-coloured areas to amplitudes between 0.5 and 1.5 mV. Scar areas (<0.5 mV) are depicted in red. The electroanatomical model is superimposed onto a RAO fluoroscopical view of the same patient after registration with the CARTO UniVu®, an upgrade of the CARTO3® system that enables visualisation of electroanatomical models on pre-recorded fluoroscopy images or cine-loops of the anatomical structures of interest. In this fluoroscopical view a coronary angiography of the left coronary system is portrayed (LAD = left anterior descending artery; LCx=left circumflex artery). B. RAO view of the left ventricle during epicardial voltage mapping. C. Left anterior oblique (LAO) view of the left ventricle during endocardial voltage mapping. Underneath the model, the mapping catheter (MAP) is visualised, laying into the pericardial cavity. An epicardial steerable sheath is used to support guidance of the catheter into pericardium. D. LAO view of the left ventricle during voltage mapping epicardially. In panel A, the yellow point corresponds to His bundle position. In panels B and D colour points correspond to certain areas with potentials of interest for ablation.
