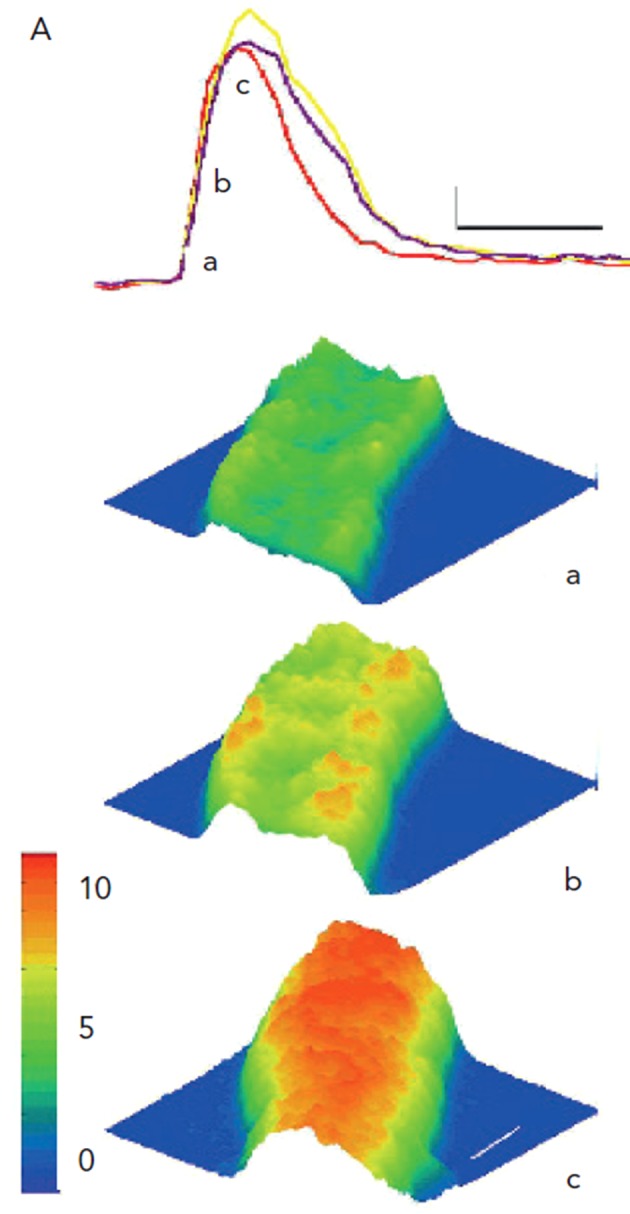
Figure 4: AP-evoked Global Ca2+ Transients in Purkinje Cells are Robust.

During the interval between stimuli, Purkinje cells are quiescent, except for occasional large Ca2+ waves (not shown here), which propagate along the cells of the aggregates. Panel A shows fluorescence intensity (Ca2+ changes) in Purkinje cells during electrically evoked depolarisation. Note the fluorescence during an electrically-evoked Ca2+ transient in three ROIs is indicated. Small letters correspond to 3D surface plots (below) of ratio images of a section of this aggregate during the transient. Ca2+ concentration is reflected by both the colour and height of the surface. The first response to a stimulus is an increase in Ca2+ (panel a), which is present mostly at the aggregate’s periphery (panel b). Peak Ca2+ change occurs later in core of aggregate (panel c). Thin calibration bars correspond to 1 F/F0 unit and 333 ms, respectively, while white lines on surface plot (panel c) correspond to 10 µm. From Boyden et al., 2003.7
