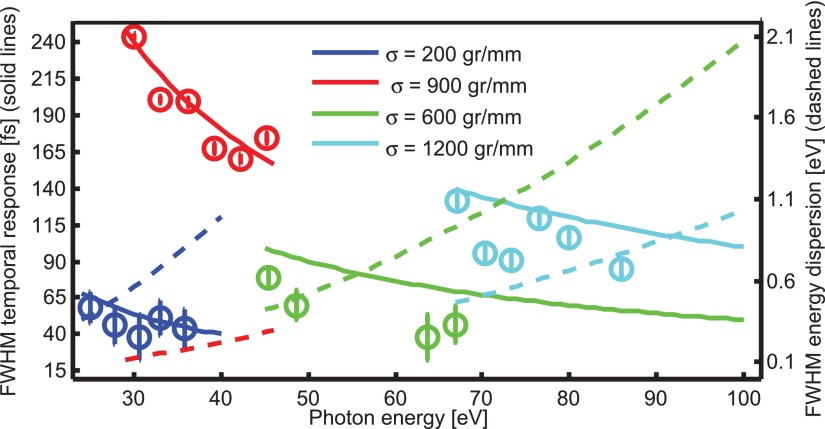
FIG. 6.
Time response and energy bandwidth of the four different gratings in the monochromator. Colors correspond to different groove densities, which are shown in the legend. Solid lines, left vertical axis: calculated temporal response by ray-tracing. Dashed lines, right vertical axis: FWHM energy dispersion calculated by using Equations (1) and (2) assuming an EUV source spot size of 100 μm. Open circles: retrieved EUV pulse duration by LAPE measurements. The error bars in the retrieved temporal response are from the uncertainly in the IR pulse duration.

