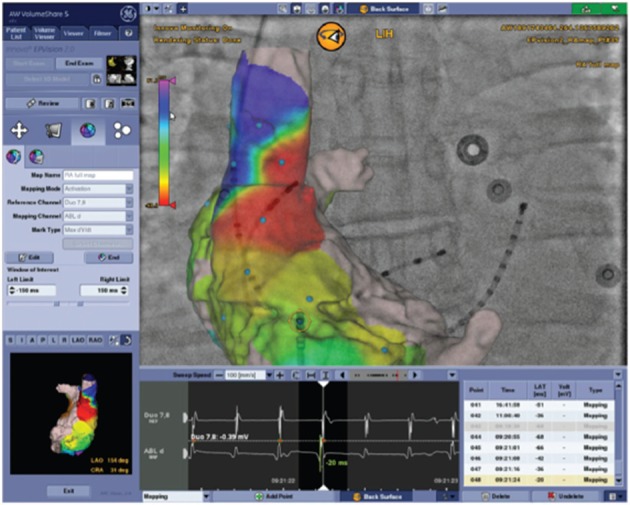
Figure 1: Three-dimensional Rotational Angiography Model of the Right Atrium, Overlaid on Two-dimensional Rotational Angiography Fluoroscopy (Postero-anterior View).

A roving catheter is tracked by software (yellow circle) and an activation map is projected on the three-dimensional shell, based on timing of local bipolar electrograms (EGMs) at the catheter tip.
