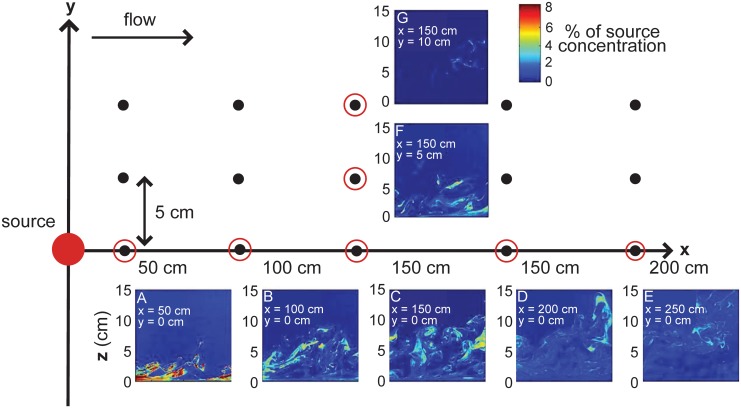
Fig 2. Odor plume PLIF videos taken at 15 locations.
Instantaneous odor concentration (expressed as % of source concentration) at (A) x = 50 cm, (B) x = 100 cm, (C) x = 150 cm, (D) x = 200 cm, (E) x = 250 cm from the source along the odor plume centerline, and (F) y = 5 cm, (G) y = 10 cm from the odor plume centerline at x = 150 cm.

