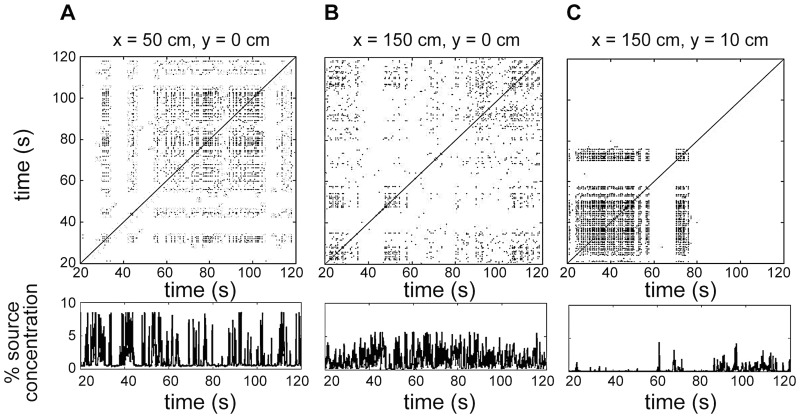
Fig 3. Recurrence plots (upper panels) and corresponding concentration time series (lower panels) for selected locations in the plume: (A) x = 50 cm, (B) x = 150 cm from the source along the plume centerline, and (C) y = 10 cm from the centerline at x = 150 cm, where height is 2.5 cm from the substratum.
Black points in the recurrence plots indicate that recurrence occurs; white regions indicate that recurrence does not occur (see Results).

