FIG. 2.
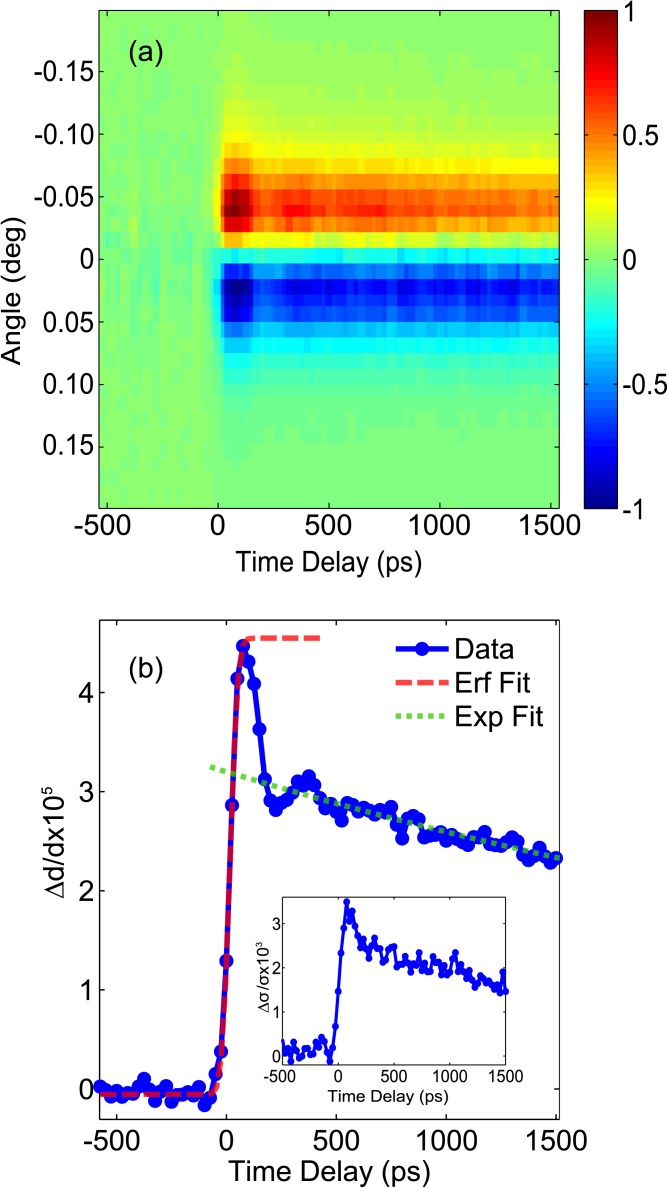
(a) 2D plot of the Bi 222 diffraction peak shift induced by 210 μJ/cm2 of 1030 nm laser light. The vertical axis is a summation across the area detector mapping the 2D detector to an angular lineout. The horizontal axis is the time delay between laser and x-ray pulses (negative time means x rays arrive first). The intensity axis is the difference (normalized to ±1) between the averaged lineout with x rays very early (before any excitation, i.e., negative time) and the lineout at each particular time point. (b) Fractional change in Bi lattice spacing Δd∕d extracted from data in (a). The dashed red line is an error function (“Erf”) fit for the initial change. The dotted green line is an exponential (“Exp”) decay fit on long time-scales. The inset shows the fractional change in the square root of the variance of the x-ray distribution on the detector along the scattering plane direction.

