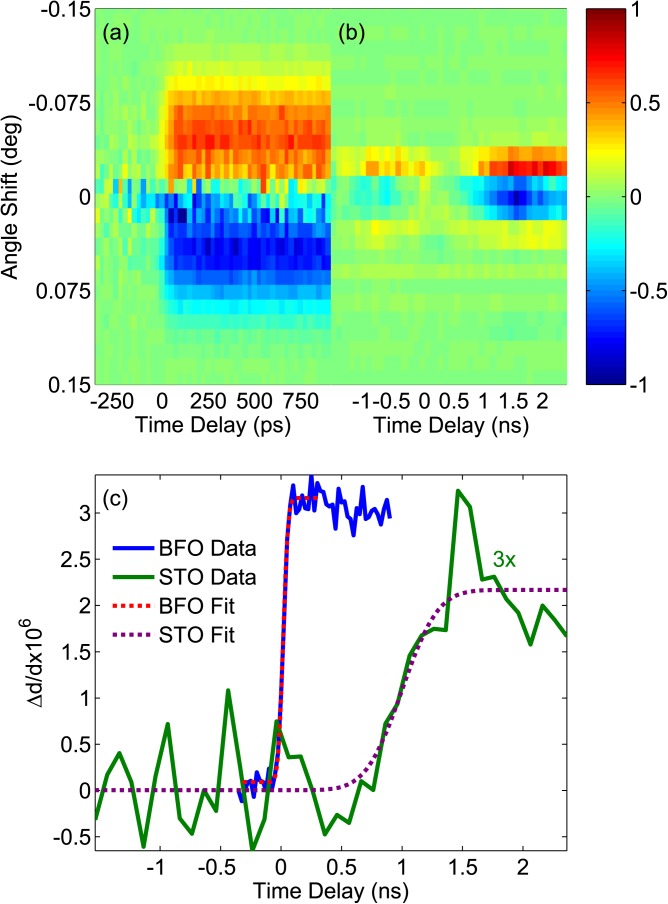
FIG. 3.
(a) 2D plot of the BFO film 220 diffraction peak shift upon excitation by 343 nm optical pulse (25 μJ/cm2 absorbed). The vertical axis is a summation across the area detector mapping the 2D detector to an angular lineout. The horizontal axis is time delay between laser and x rays. The intensity axis is the difference (normalized to ±1) between the average lineout with x rays very early (before any excitation) and the lineout at each particular time point. (b) 2D plot similar to (a) for the STO substrate. (c) Fractional change in BFO film (blue) and STO substrate (red) lattice spacings. Red (purple) dashed line is error function fit to the BFO (STO) rise time. There is a clear delay between the temporal overlap of the x-ray and laser pulses (∼t = 0) and the actual onset of a change in the STO, while the change in the BFO happens immediately. Note the STO data are scaled by a factor of 3 for ease of comparison with the BFO data and are averaged over several neighboring times for smoothing.

