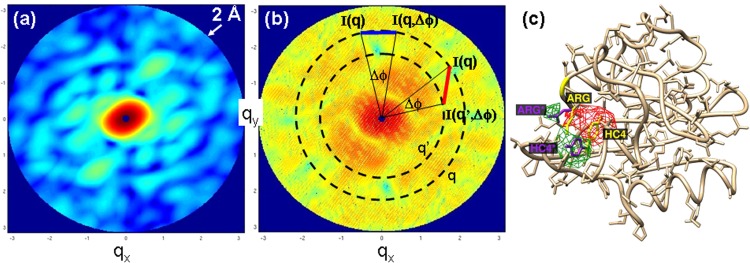
FIG. 4.
Structures from solution by analysis of the average angular correlations. (a) Intensity distribution from four molecules of random orientation and average distance of 150 Å from each other overlaid incoherently; is 2π with the scattering vector; resolution at the edge: 2 Å. (b) Coherent diffraction from an ensemble of four molecules of random orientation and average distance of 150 Å. Young's fringes can be easily identified. Blue bar: I(q) and I(q, Δϕ) on same resolution ring; red bar I(q) and I(q′, Δϕ) on different resolution rings. (c) Difference electron density recovered from simulated δBl(q,q′), courtesy of Kanupriya Pande. Position of the chromophore head as well as a Arg52 changed relative to the reference structure. Red: negative difference electron density, green: positive difference electron density.

