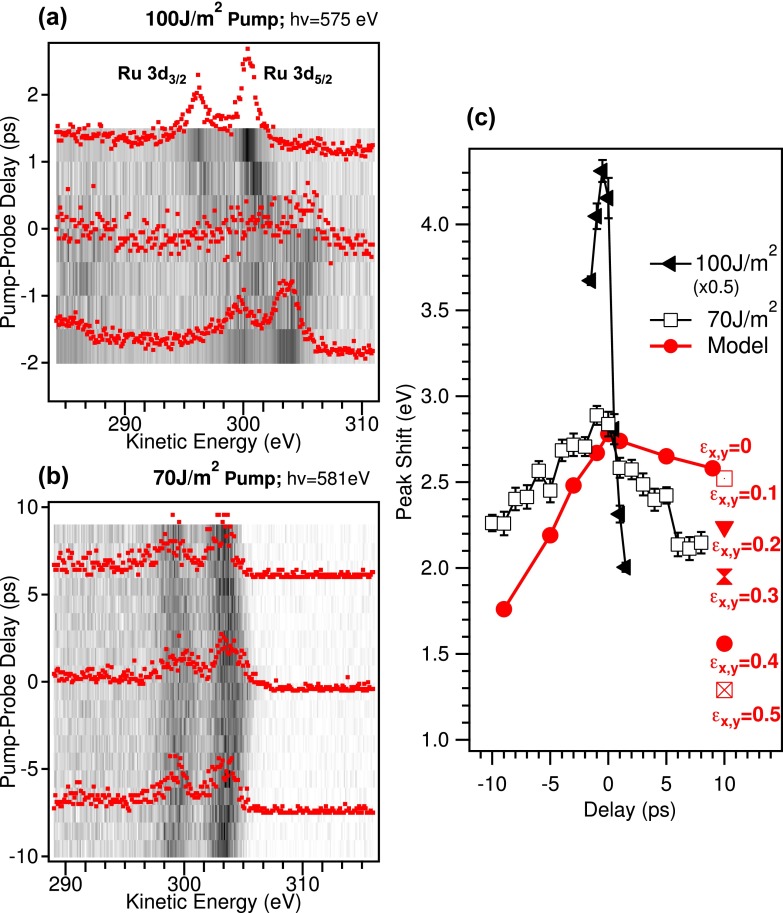
FIG. 3.
Ru 3d photoemission lines as a function of pump-probe delay with optical fluence on the sample 100 J/m2 and 70 J/m2 ((a) and (b)). Positive pump-probe delay indicates that the probe pulse hits the sample after the pump. Spectra at selected time delays are displayed on the 2D plots. The acquisition time for each 2D plot was about 1.5 h. (c) Measured energy shift of Ru 3d5∕2 with respect to the unpumped case in (a) and (b) (black lines). The high fluence data have been scaled by 0.5. In red, the modelled energy shift by using ASTRA for normalized emittance equal to zero is plotted, i.e., no momentum broadening on the pump ejected electrons. The energy shift at 10 ps calculated for several beam emittances (π mm mrad) is indicated by the labels close to the respective markers.

