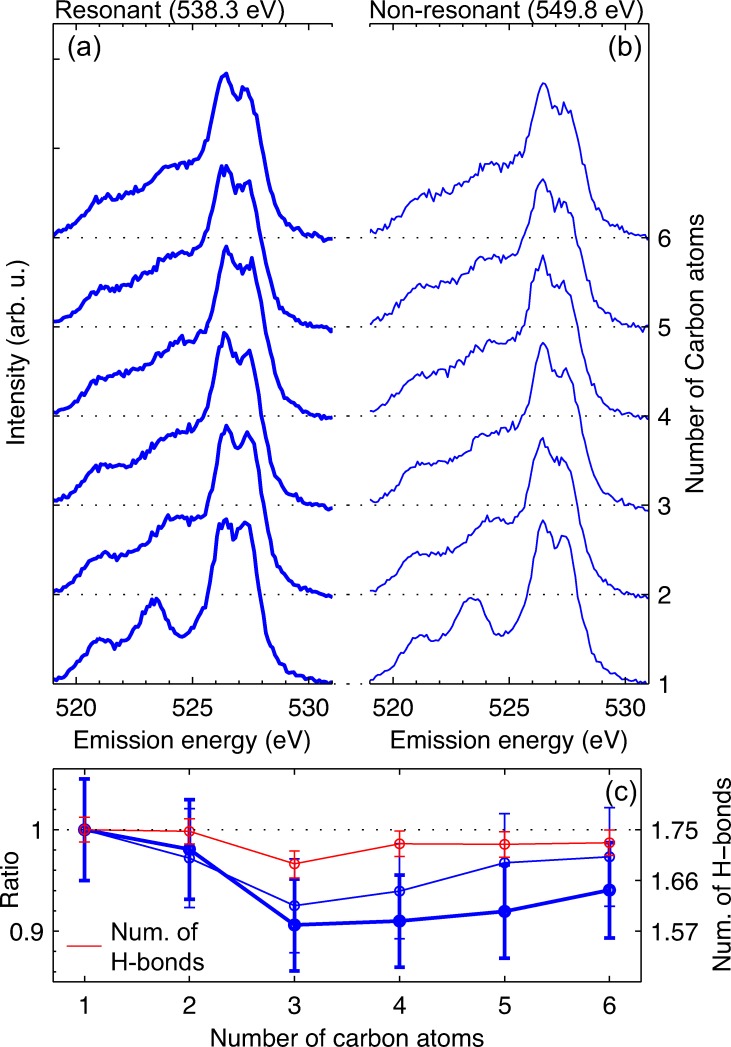
FIG. 6.
Impact of the hydrogen bond network on the split peak structure. RIXS spectra for (a) resonant and (b) non-resonant excitation of linear alcohols in the liquid phase with one to six carbon atoms (methanol to hexanol). The spectra are offset for clarity. The corresponding XA spectra measured in total fluorescence yield are shown in the supplementary material34 (c) Mean number of hydrogen bonds per molecule29 (red line) as a function carbon chain length together with the ratio of the two split peak components (high-energy/low-energy). Thick and thin blue lines correspond to the ratio at resonant and non-resonant excitation. A description of the error estimate is given in the supplementary material.34 All values are normalized to the value for methanol (left y-scale). The y-scale on the right gives the number of hydrogen bonds.

