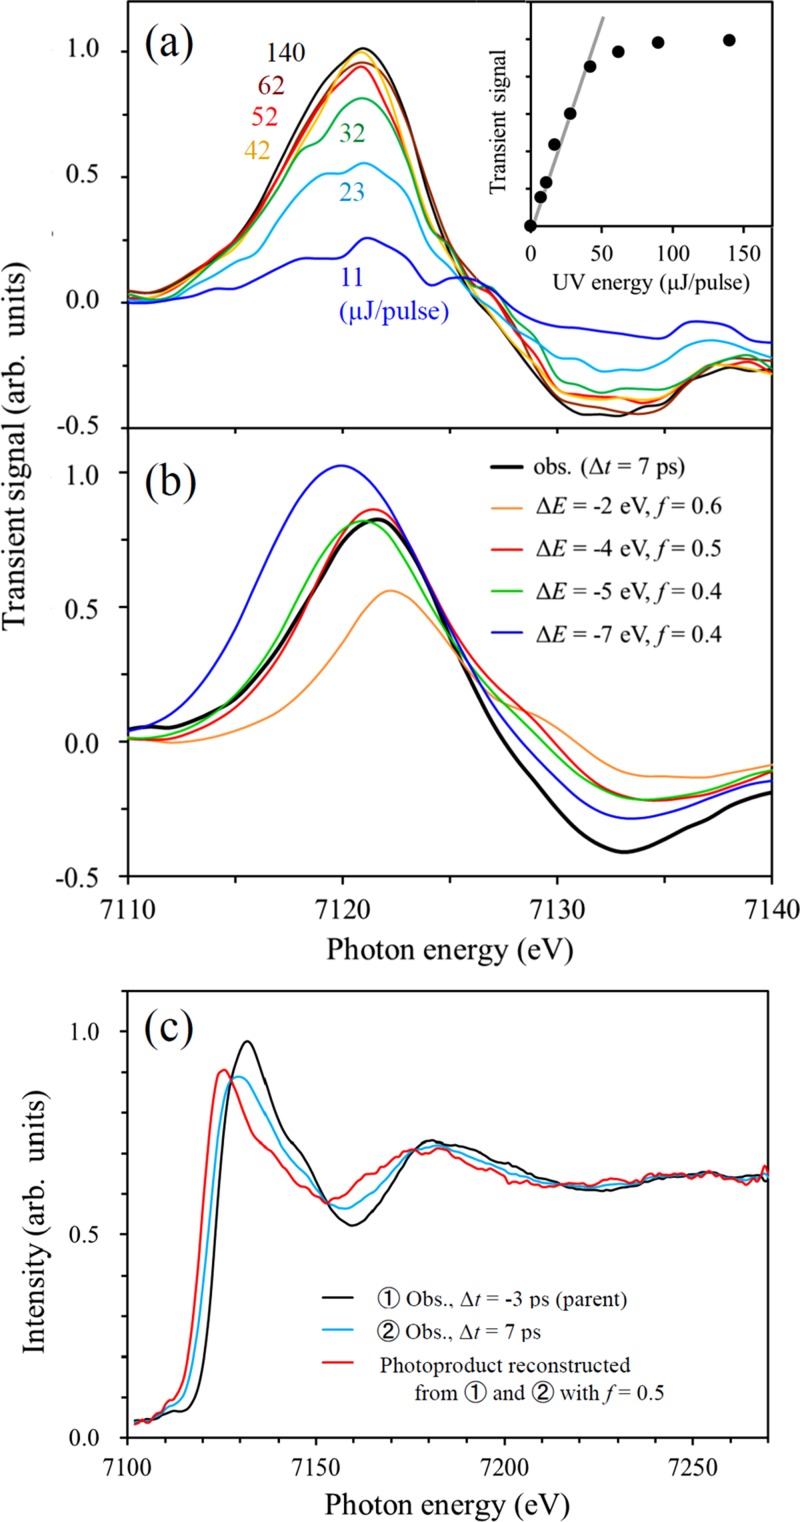
FIG. 6.
(a) Dependence of the difference spectrum on the 268 nm pulse energy. The inset shows the absorption peak intensity as a function of UV pulse energy. (b) Comparison of the observed difference spectrum and simulated spectra assuming various K-edge shifts (ΔE) and fractional populations of the photoproducts (f). The simulated spectra are in reasonable agreement with the observed one when ΔE is assumed to be −4 and −5 eV. (c) Reconstructed spectrum of the photoproduct (red) generated from the static spectrum of [Fe(III)(C2O4)3]3− (s = 5/2) (black) and the difference spectrum measured at t = 7 ps (blue), assuming f = 0.5.

