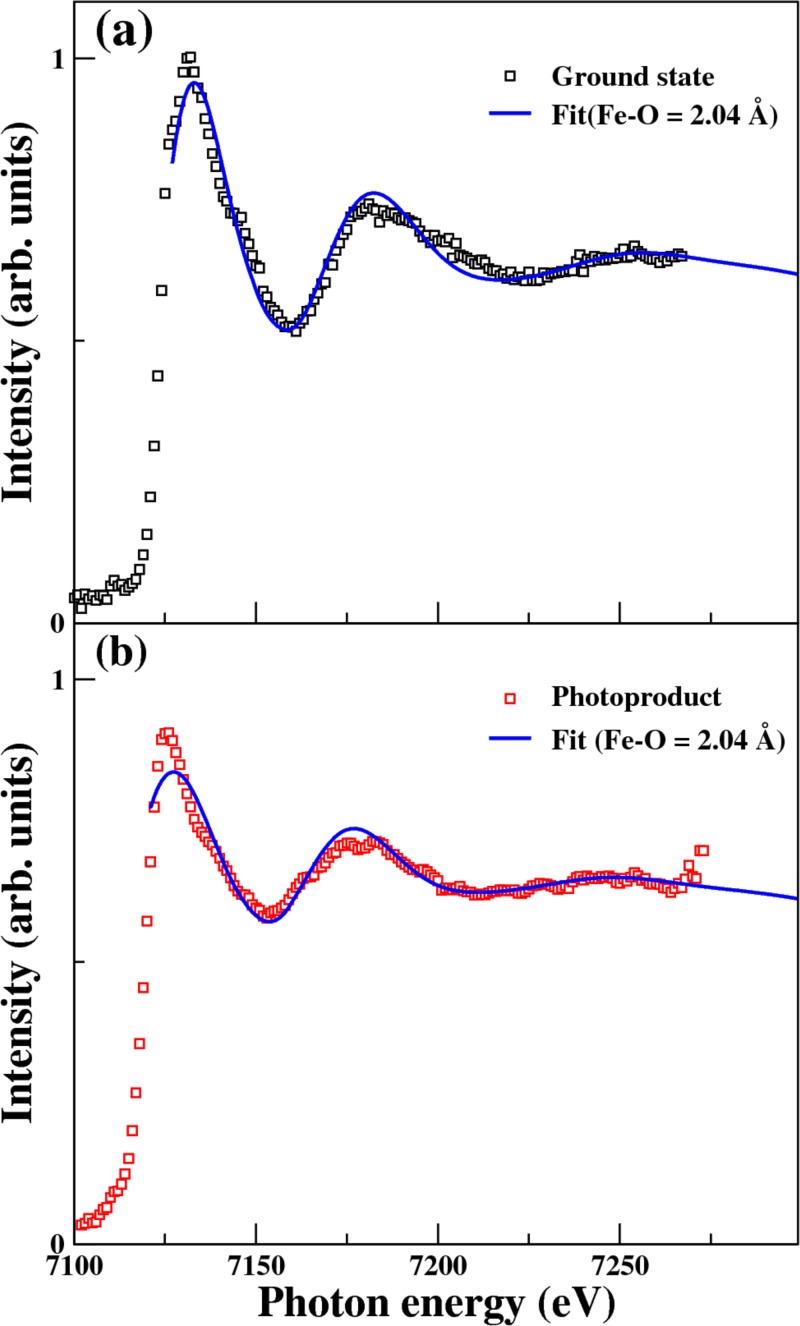
FIG. 8.
(a) A fit (solid blue line) to the fluorescence X-ray absorption spectra μ(E) (black squares), in which the oscillatory structure χ(E) is given by χ(E) = [μ(E) − μ0(E)]/μ0(E). μ0(E) is a smooth background modeled by a(E − E0) + b with best-fit parameters of a = −0.000357(eV−1), b = 3.22, and E0 = 7127 eV. χ(E) is simulated for the ground state of [Fe(III)(C2O4)3]3− using FEFF6 with the geometries calculated by TDDFT (Fe-O = 2.04 Å). (b) A fit to the reconstructed product absorption spectra (red squares). In this case, χ(E) is simulated for [Fe(II)(C2O4)2]2− (Fe-O = 2.04 Å). The best-fit parameters are a = −0.000393 (eV−1), b = 3.48, and E0 = 7121 eV.

