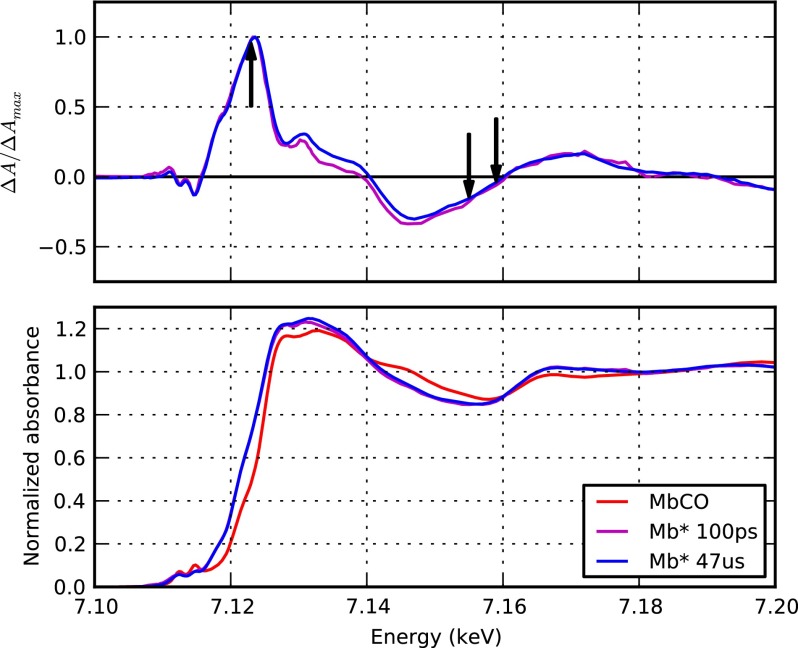
FIG. 2.
XANES spectra of myoglobin at the Fe K-edge. XANES spectra obtained by Stickrath et al. (2013) at the advanced photon source synchrotron are reported. Bottom panel: the steady-state MbCO spectrum (red) is compared with the photoproduct (Mb*) spectra at 100 ps (magenta) and at 47 μs (blue) from photolysis of MbCO (all data were provided by Prof. Lin Chen, Northwestern University). Upper panel: normalized difference spectra calculated from the data reported in the lower panel show that no significant change is observed between 100 ps (magenta) and 47 μs (blue) from photolysis; black arrows indicate the X-ray energies of 7.123, 7.155, and 7.159 keV at which XFEL time-scans have been recorded during the LCLS experiment.

