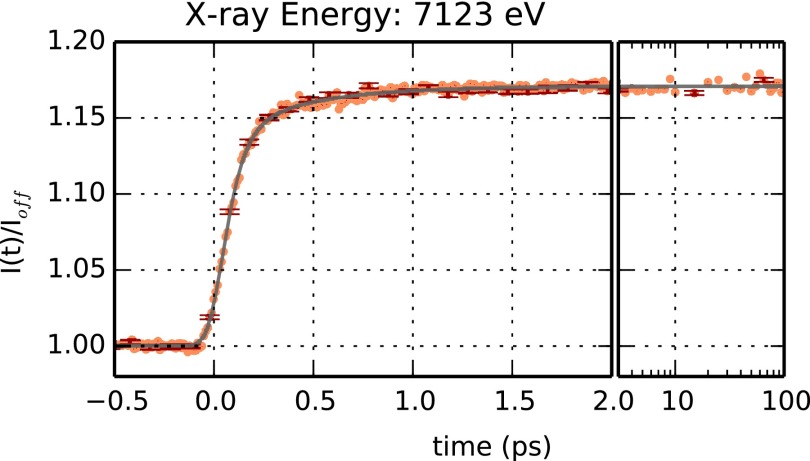
FIG. 4.
Time dependence of the absorption at the Fe K-edge (7123 eV) after photolysis of MbCO. The ratio between the total fluorescence signal, I(t), and the average signal in the absence of photolysis, Ioff, is plotted as a function of time (orange symbols). Left panel: data between −0.5 and 2 ps. Right panel: data between 2 and 100 ps plotted in a logarithmic time scale. Negative times correspond to X-ray pulses arriving at the sample before the optical pulses. Errorbars (corresponding to one standard deviation) are shown every 10 experimental points (red symbols). The experimental time evolution was fitted in terms of the convolution between a normalized Gaussian function and the sum of two exponential functions (black line) (Lemke et al., 2013). The fitting parameters for the two exponential functions are τ1 = 73 ± 5 fs (80 ± 3%) and τ2 = 400 ± 20 fs (20 ± 3%); the Gaussian width is 53 ± 2 fs (RMS).

