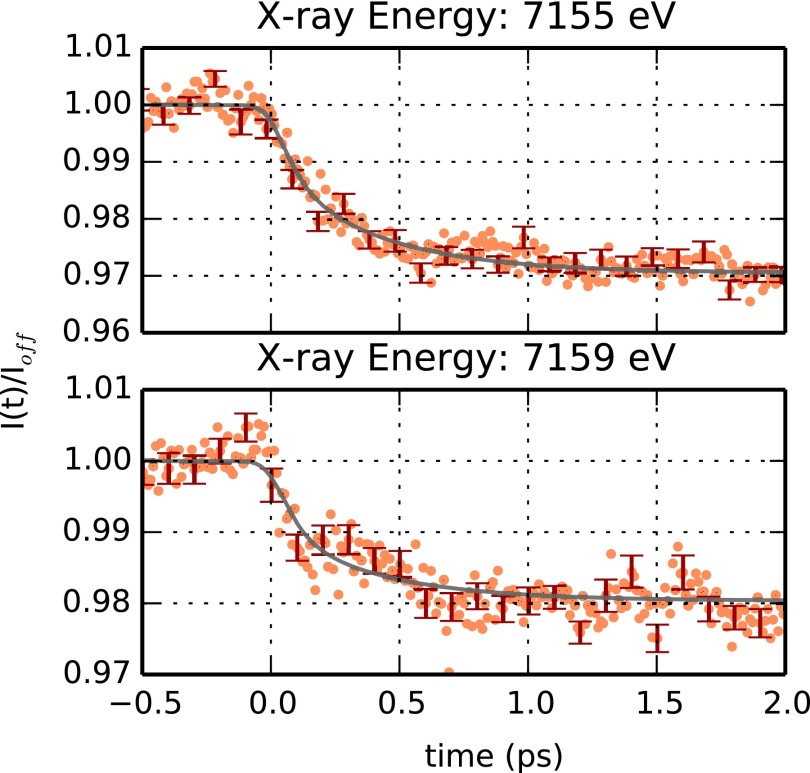
FIG. 5.
Time dependence of the absorption at 7155 and 7159 eV after photolysis of MbCO. The ratio between the total fluorescence signal, I(t), and the average signal in the absence of photolysis, Ioff, is plotted as a function of time (orange symbols) between −0.5 and 2 ps. Errorbars (corresponding to one standard deviation) are shown every 10 experimental points in red. The time evolutions observed at 7155 eV (upper panel) and at 7159 eV (bottom panel) can be satisfactorily described using the same exponential characteristic times obtained from the fit of the data obtained a 7123 eV. The relative weight of the 73 fs component with respect to the 400 fs one, are 40 ± 3% and 48 ± 4% for the data at 7155 and 7159 eV, respectively.

