FIG. 3.
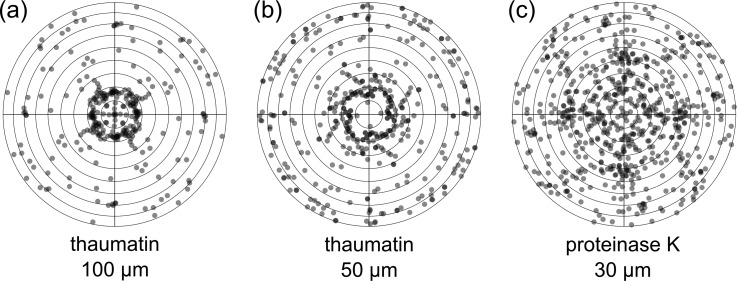
(a) Overview of the orientation distribution of 100 μm thaumatin crystals (number of crystals n = 69), (b) 40–50 μm thaumatin crystals (n = 102), and (c) 30 μm proteinase K crystals (n = 165) mounted in crystallography chips of matching sizes (100, 50, and 30 μm features). The dots in transparent grey represent the beam directions relative to the crystal coordinate system in Lambert equal-area projection. Dark grey indicates overlap of two or more dots. The centers of the diagrams correspond to the tetragonal c axes, the outermost circle to directions in the a,b-plane. Each “observed” direction is replicated according to the point group (422) but, of all symmetry-related directions, only those pointing to the upper hemisphere are shown. In principle, three parameters are required to define the orientation of a crystal, but for the present purpose, the two angles shown in Figure 3 are sufficient. The third angle, representing rotation of the crystal around the beam direction, is superfluous as this parameter determines the orientation of the diffraction pattern in the detector plane, without changing the pattern itself. Figure prepared with R.33

