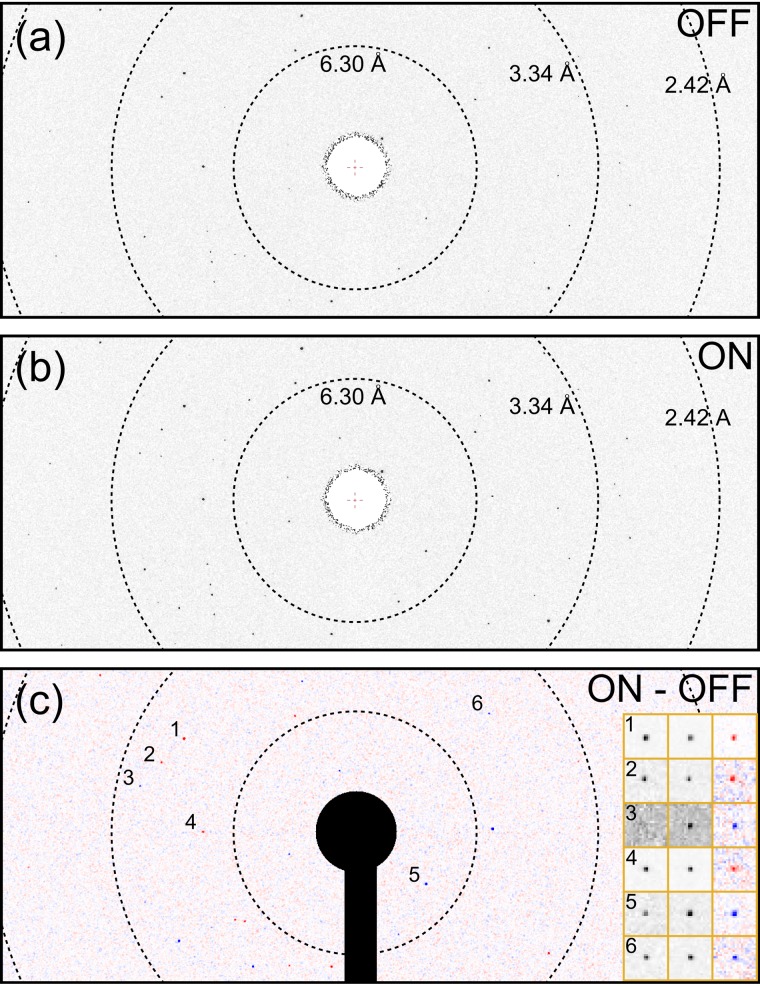
FIG. 4.
X-ray diffraction of a crystal of CO bound sperm whale myoglobin, SW-MbCO, (a) before and (b) after photoexcitation. The time delay was 0.9 ps. (c) is the difference pattern, (b)–(a), calculated after background subtraction and normalization for equal X-ray pulse energy. The inset in (c) shows the reference (OFF), pump-probe (ON), and difference diffraction (from left to right) in the vicinity of six reflections with higher magnification. Blue in the difference pattern is increasing, and red decreasing intensity relative to the reference.

