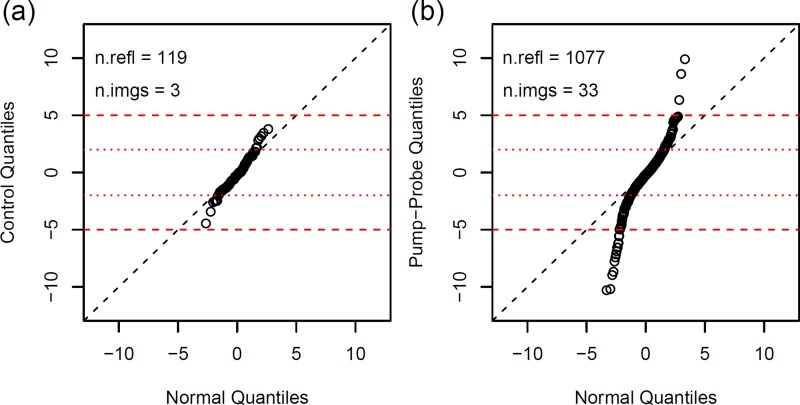
FIG. 5.
Distributions of standardized intensity differences, ZD. Quantile–quantile plots comparing the distribution of ZD values for control data (a) and pump–probe data (b) with the standard normal distribution N(0, 1). The control data are almost normally distributed. Most of the intensity differences are within ±2σ from zero (dotted red lines), showing that the differences measured in control experiments are mainly due to counting statistics. Only a minor portion of the differences may be attributed to experimental instabilities (leading to systematic errors not included in the σ values) as indicated by the small deviation from the diagonal. By contrast, ZD values for pump–probe data (b) are random samples from a much broader distribution with observations up to 10σ, as expected if the variance is dominated by light-induced changes of the crystal structure. Only reflections with recorded intensities >5σ have been used for the quantile–quantile plot. Figure prepared with R.33

