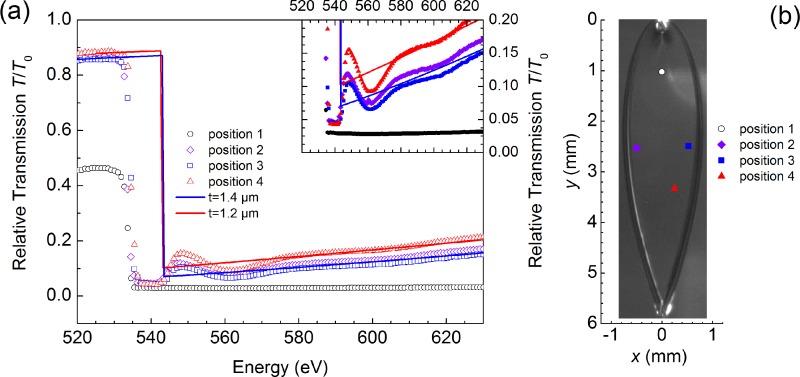
FIG. 4.
Soft-x-ray transmission spectra of the liquid water flatjet near the O K-edge. Measurements were recorded at different positions in the flatjet. Experimental results (dots) are compared with values calculated using the Henke tables38 (solid lines) using a water flatjet thickness h ranging from 1.4–2.1 μm. The inset shows a blow-up of the recorded transmission spectra around the edge jump absorption at the O K-edge. These spectra were each recorded on a 15 min time scale. The positions of the different scans are indicated in the sketch of the flatjet. The photo of the flatjet was not taken during these measurements and should only be considered as a guide.

