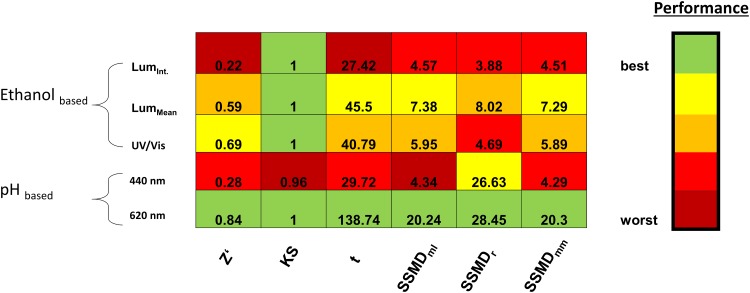
Fig 3. Matrix of different statistical parameters for evaluation of HTS assays.
For each parameter the assays were ranked from the best (green) to the worst assay (red). The assays were grouped by the kind of detection. Ethanol quantification: Lum(int), Lum(mean), UV/Vis (ethanol dehydrogenase assay). pH-indicator assay at 440 and at 620 nm.

