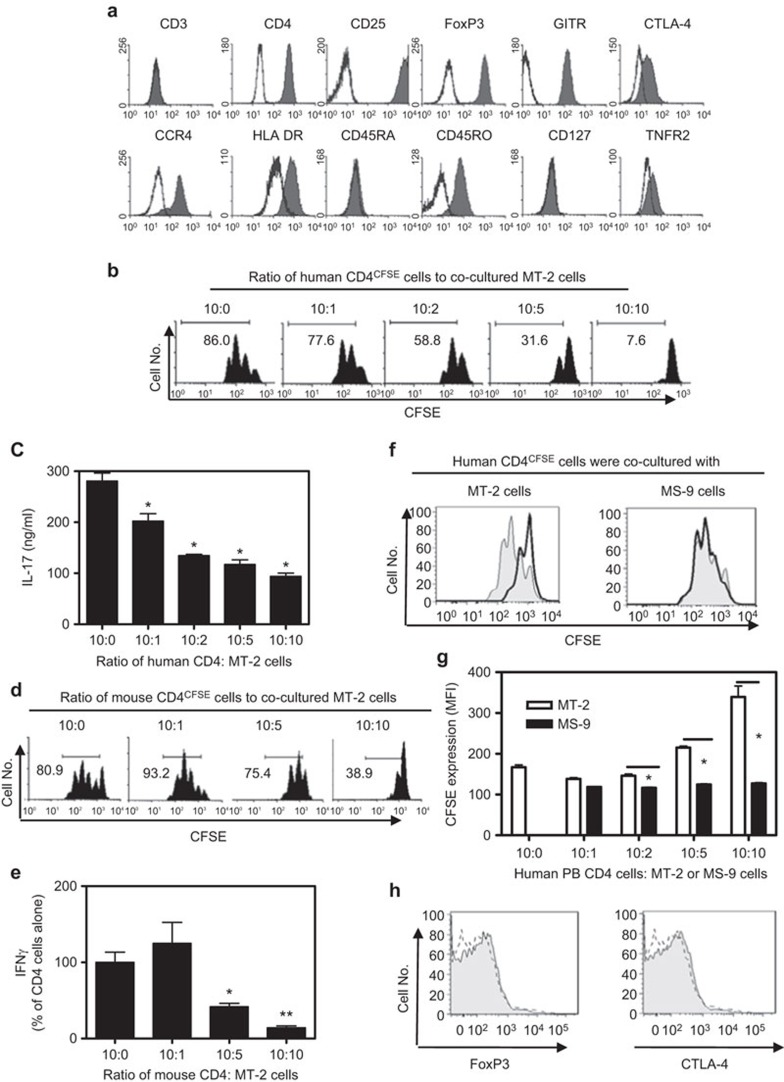
Figure 1.
(a) FACS analysis of MT-2 cells. MT-2 cells were stained with the indicated anti-human Abs. CTLA-4 and FoxP3 were used to stain intracellularly, whereas the other antibodies stained the cell surface. Gray histogram shows antibody staining. Isotype controls are shown by line histogram. (b–e) Suppressive effect of MT-2 cells on primary human PB CD4 cells and primary mouse CD4 cells. MACS-purified PB human CD4 cells or mouse CD4 cells were stained with CFSE and were cocultured with MT-2 cells at the indicated ratios. The cells were stimulated with APCs and anti-CD3 Ab for 3 days. The proliferation of PB human CD4 cells (b) or mouse CD4 cells (d) was measured by CFSE dilution with FACS. The percentage of CFSE-diluted cells is shown in the histograms. Production of IL-17 by human CD4 cells (c) and IFN-γ by mouse CD4 cells (e) in the supernatant was determined and the data shown (mean±s.d., N=3–5) represent the summary from three separate experiments. Compared with CD4 cells alone: *P<0.05, **P<0.01. (f–h) The phenotypic and functional properties of HTLV-1-infected MS-9 cells. CFSE-labeled human PB CD4 cells were cocultured with MT-2 cells or MS-9 cells at the desired ratio. The cells were stimulated with APCs and anti-CD3 Ab for 3 days. The proliferation of human PB CD4 cells was measured by CFSE dilution with FACS. (f) Typical FACS analysis. Gray histogram: human PB CD4 cells cultured alone (without MT-2 or MS-9 cells); solid line histogram: human PB CD4 cells cultured with MT-2 cells (left) or MS-9 cells (right) at a ratio of 10∶10. (g) CFSE expression (MFI) by human PB CD4 cells when cultured alone, cocultured with MT-2 cells (open bar), or with MS-9 cells (black bar). *P<0.05 (mean±s.d., N=3). (h) Intracellular expression of FoxP3 and CTLA-4 by MS-9 cells was analyzed by FACS. Gray histogram: anti FoxP3 Ab or anti CTLA-4 Ab staining. Dashed line histogram: isotype control staining. The data shown are representative of at least three separate experiments with similar results.

