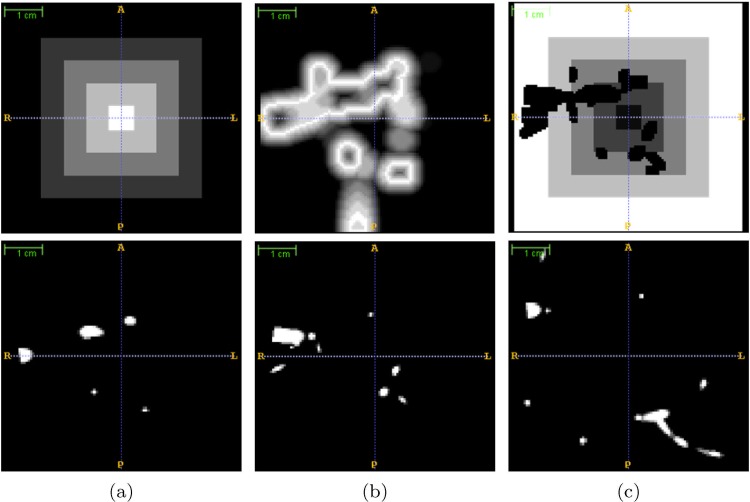
Fig 3. Example of oxygenation maps used in the synthesis of a bronchopulmonary segment phantom.
The first row displays the central slices of the 3D oxygenation maps for arteries (a), airways (b), and veins (c); bright/dark areas indicate high/low levels of oxygenation demand, and therefore, the probability of growing structures there. The second row shows the 3D structures generated from the corresponding oxygenation maps, which are used to define subsequent oxygenation maps for the following structures. Null oxygen demands in places already occupied by previous structures can be observed in the top of (b) and (c).

