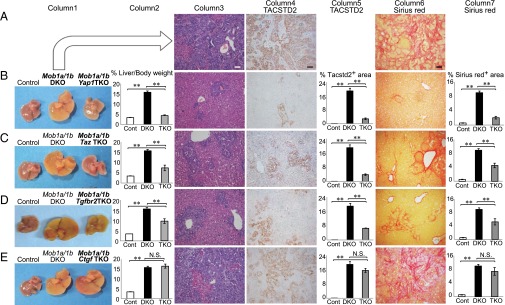
Fig. 5.
Mob1a/1b-deficient liver phenotypes are dependent on Yap1, Taz, and Tgfbs but not on Ctgf. Analyses of livers from Mob1a/1b triple mutant (TKO) strains. Row A: Stained liver sections from Mob1a/1b DKO (LDKO) mice (AlbCre;Mob1aflox/flox;Mob1b−/−: n = 27) for comparison with TKO mouse liver sections below. Rows B–E: Comparative analyses of liver sections from control (Mob1aflox/flox;Mob1b−/−: n = 25), Mob1a/1bDKO (n = 27), and various Mob1a/1b TKO mutants at P14. (B) Mob1a/1b plus Yap1 TKO (AlbCre;Mob1aflox/flox;Mob1b−/−;Yap1flox/flox) (n = 11); (C) Mob1a/1b plus Taz TKO (AlbCre;Mob1aflox/flox;Mob1b−/−;Taz−/−) (n = 10); (D) Mob1a/1b plus Tgfbr2 TKO (AlbCre; Mob1aflox/flox;Mob1b−/−;Tgfbr2flox/flox) (n = 36); and (E) Mob1a/1b plus Ctgf TKO (AlbCre;Mob1aflox/flox;Mob1b−/−;Ctgfflox/flox) (n = 14). Column 1: Macroscopic views of livers of P14 mice of the indicated genotypes. Column 2: Liver weight as a percentage of body weight for the mice in Column 1. Column 3: H&E-stained liver sections. (Scale bar, 50 μm.) Column 4: TACSTD2 immunostaining. (Scale bar, 50 μm.) Column 5: Area of TACSTD2+ cells per field. Column 6: Sirius red staining to detect fibrosis. (Scale bar, 50 μm.) Column 7: Area of liver fibrosis per field. For columns 2, 5 and 7, data are the mean ± SEM *P < 0.05, **P < 0.01. N.S., not significant.

