Fig. 3.
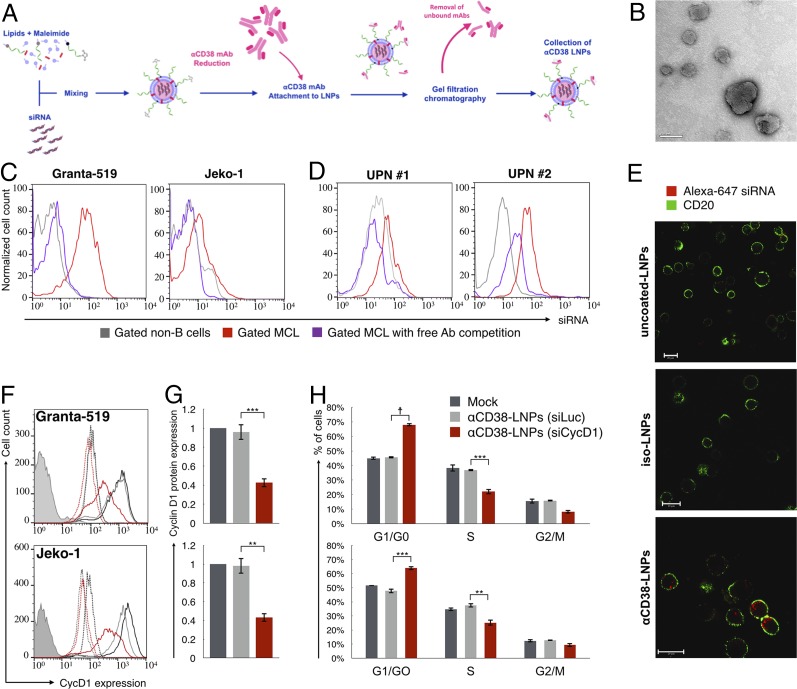
αCD38–LNPs–siRNA mediate active delivery of siRNA specifically into MCL cells and induce antitumor gene silencing. (A) Schematic diagram of the αCD38–LNPs–siRNA production process. (B) Transmission electron microscopy image of αCD38–LNPs–siRNA. (Scale bar: 100 nm.) (C) Granta-GFP (Left) or Jeko-GFP (Right) were cocultured with TK-1 (murine T-lymphoma) cells and incubated with αCD38–LNPs–siRNA entrapping labeled siRNA. (D) Mononuclear cells from two blood samples of MCL patients were incubated with αCD38–LNPs–siRNA including labeled siRNA. C and D exhibit siRNA-LNPs binding to non-B cells (gray), MCL cells (red), or MCL cells in samples incubated with free competing αCD38 mAbs before αCD38–LNPs–siRNA incubation (purple). (E) Granta-519 cells uptake of siRNA delivered via indicated LNPs and visualized by live confocal microscopy. (Scale bar: 20 μm.) (F and G) Granta-519 (Upper) or Jeko-1 (Lower) were incubated with mock (black), αCD38-LNPs-siLuc (gray), or αCD38-LNPs-siCycD1 (red). Forty-eight hours post treatment, cells were analyzed for cycD1 protein expression by flow cytometry. (F) Representative data from one of five (Granta) or three (Jeko) experiments. Continuous lines: cycD1 staining. Dashed lines: isotype control. Filled histogram: unstained. Complete data are represented in G. Bar plots represent mean ± SEM of cycD1 expression normalized to mock (**P < 0.01; ***P < 0.001; one-way ANOVA test with Bonferroni correction). (H) Cell cycle distribution of cells 48 h post treatments with mock (black), αCD38-LNPs-siLuc (gray), or αCD38-LNPs-siCycD1 (red) analyzed by flow cytometry. Bars represent mean percentage ± SEM of n = 4 from two independent experiments per cell line (**P < 0.01; ***P < 0.001; ☨P < 10−4; one-way ANOVA test with Bonferroni correction).

