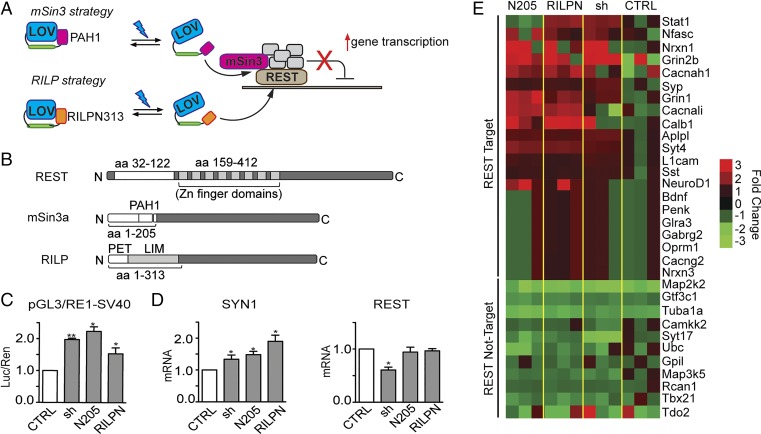
Fig. 1.
Strategies for REST inhibition. (A) Schematic cartoon of the inhibition strategy. mSin3a (Upper) or RILP (Lower) interfering domains are directly fused to AsLOV2. In the dark, AsLOV2 is in a closed conformation, masking the REST-binding sites. On blue light illumination (470 nm), AsLOV2 unfolds thus freeing the C-terminal domains to interact with REST, displacing the endogenous mSin3a or the entire REST complex from target DNA. This would result in the increased transcription of REST-target genes. (B) Schematic representation of REST, mSin3a, and RILP protein sequences. The interacting portions between REST and mSin3a/RILP are highlighted. PAH1, paired amphipathic helix 1; PET, Prickle Espinas Testin; LIM, Lin11, Isl-1, and Mec-3. (C) HeLa cells were transfected with a reporter vector in which the expression of the luciferase gene is modulated by the SV40 promoter fused to a RE1 cis-site (pGL3-RE1/SV40), in the absence (white bars) or presence (gray bars) of expression plasmids encoding for mSin3a N205 (N205), RILP N313 (RILPN), or shRNA against REST (sh), as indicated. Control samples (CTRL) were cotransfected with the empty vector corresponding to the effector plasmids. Luciferase activity was measured 48 h after transfection. Data were first normalized to the activity of the cotransfected TK-Renilla reporter vector and subsequently to the activity of the reporter gene alone, set to 1 (*P < 0.05; **P < 0.01; one-way ANOVA followed by the Tukey's multiple comparison test vs. control; n = 3 independent experiments). Luc/Ren, Luciferase/Renilla ratio. (D) SYN1 and REST mRNA levels were quantified by qRT-PCR in N2a cells 48 h after the transfection of expression plasmids encoding for mSin3a N205, RILP N313, or shRNA against REST, as indicated. RPS9, GAPDH, and HPRT1 were used as control housekeeping genes. (*P < 0.05 vs. control; one-way ANOVA followed by the Tukey's multiple comparison test vs. control; n = 3 independent experiments). (E) Heat map of various RE1-containing and noncontaining genes whose transcription was analyzed by the NanoString nCounter gene expression system in undifferentiated N2a cells 48 h after the transfection of expression plasmids encoding for mSin3a N205, RILP N313, shRNA against REST or an empty vector (CTRL). Values were normalized against five housekeeping genes (PPIA; Pgk1; Hdac3; GAPDH; and HPRT) and then reported as ratio of the control samples. The color represents the expression level of each gene (red for high expression, green for low expression). The analysis was performed using the nSolver Analysis Software 2.5. Primer sequences and numerical values are reported in Tables S1 and S2.

