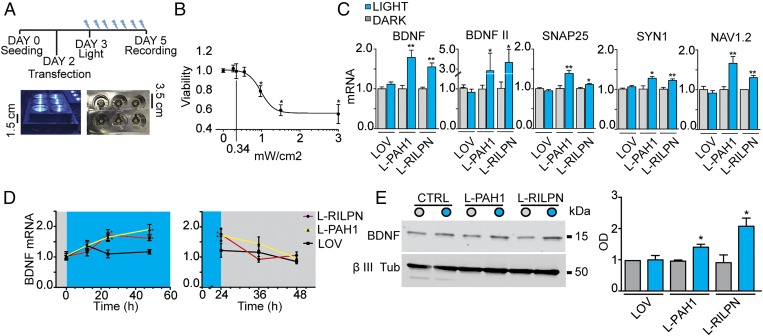
Fig. 5.
Photostimulation of AsLOV2-PAH1 and AsLOV2-RILP N313 constructs. (A) Illustration of the illumination protocol and LED stimulation apparatus. (Upper) Cells were seeded at day 0 and transfected at day 2. The illumination protocol was started 1 d after transfection, for 48 h. (Lower) Cells are 1.5 cm above a 470-nm light emitting LED. (B) Effect of light exposure on N2a cells viability. Cells were subjected to 470-nm light illumination (0.5 Hz) at the indicated intensities, and viability was measured after 48 h of stimulation (*P < 0.05; one-way ANOVA followed by the Tukey’s multiple comparison test vs. control; n = 3 independent experiments). (C) Undifferentiated N2a cells were transfected with the indicated constructs and then subjected to 470-nm light illumination (0.5 Hz) or kept in the dark, as indicated. After 48 h, the mRNA levels of the indicated genes were quantified via qRT-PCR. GAPDH and HPRT1 were used as control housekeeping genes (*P < 0.05; **P < 0.01; Student t test; n = 3 independent experiments). (D) Time-course of light-dependent BDNF up-regulation and postillumination recovery (*P < 0.05; Student t test vs. respective dark condition; n = 3 independent experiments). (E) Western blot analysis of BDNF in undifferentiated N2a cells transfected with the indicated constructs. A representative experiment is shown on the left, whereas the quantification is shown on the right (*P < 0.05; Student t test vs. the respective dark conditions; n = 3 independent experiments). LOV, AsLOV2; L-PAH1, AsLOV2-PAH1; L-RILPN, AsLOV2-RILP N313.

