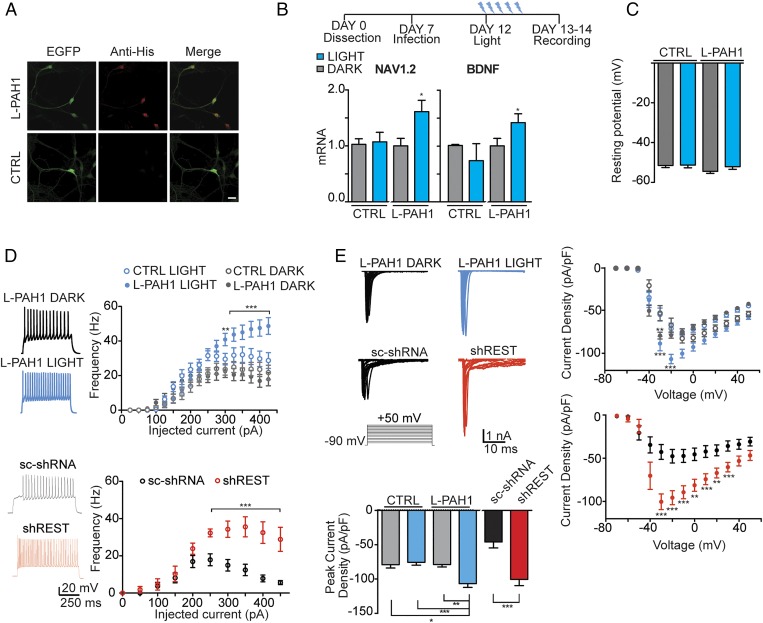
Fig. 6.
AsLOV2-PAH1 inhibits REST activity in primary neurons. (A) Confocal images of primary cortical neurons infected with a bidirectional lentiviral vector expressing either EGFP (CTRL) or AsLOV2-PAH1/EGFP. Neurons were stained using anti-Histidine tag antibodies (red) to detect the AsLOV2 construct, and anti-EGFP (green) antibodies to detect EGFP. (Scale bar, 10 μm.) (B, Upper) Schematic representation of the time course of the experiment: neurons were infected at day 7, the illumination protocol was started 5 d after infection (day 12) for 24 h. (B, Lower) qRT-PCR for NAV1.2 and BDNF mRNA in EGFP (CTRL) or AsLOV2-PAH1–expressing neurons kept under dark (gray bars) or lit (blue bars) conditions for 24 h. GAPDH and HPRT1 were used as control housekeeping genes (*P < 0.05; one-way ANOVA followed by the Tukey’s multiple comparison test vs. the respective dark control; n = 3 independent experiments). (C) Resting potential of cortical neurons infected with CTRL and AsLOV2-PAH1 and kept for 24 h under either dark or lit conditions. No significant differences were observed among the various conditions. (D, Upper) Plot of the mean (±SEM) firing frequency vs. injected current (F/I curve) in cortical neurons infected with either AsLOV2-PAH1 (closed symbols) or EGFP alone (CTRL, open symbols) and subjected to either 24-h light (blue symbols) or 24-h dark (gray symbols) (AsLOV2-PAH1/dark, n = 22; AsLOV2-PAH1/light, n = 21; EGFP/dark, n = 19; EGFP/light, n = 20; from three independent experiments). Representative current-clamp recordings of spike trains evoked by injection of 225 pA for 500 ms in neurons infected with AsLOV2-PAH1 and kept for 24 h under dark (black) or lit (blue) conditions are shown on the left. (D, Lower) The same experiment was performed in neurons infected with either a scrambled shRNA or shRNA against REST (n= 11 for each condition). (E) Mean current–voltage (I/V) relationship expressed as current density in cortical neurons infected with AsLOV2-PAH1, EGFP alone, scrambled shRNA, or shRNA against REST. Experimental conditions were as described in D (n= 30 for each condition). The stimulation protocol and representative INa+ traces obtained in the cell-attached configuration at various voltages are shown on the Upper Left. Current density was calculated by normalizing the Na+ current amplitude to the cell capacitance and plotted as means (±SEM) vs. the applied voltage. The mean (±SEM) peak Na+ current density evoked at −20 mV in the indicated groups is shown in the bar plot on the Lower Left. In D and E, *P < 0.05; **P < 0.01; ***P < 0.001; two-way ANOVA followed by the Bonferroni’s multiple comparison test. LOV, AsLOV2; L-PAH1, AsLOV2-PAH1; L-RILPN, AsLOV2-RILP N313; shREST, shRNA for REST; sc-shRNA, scrambled shRNA.

