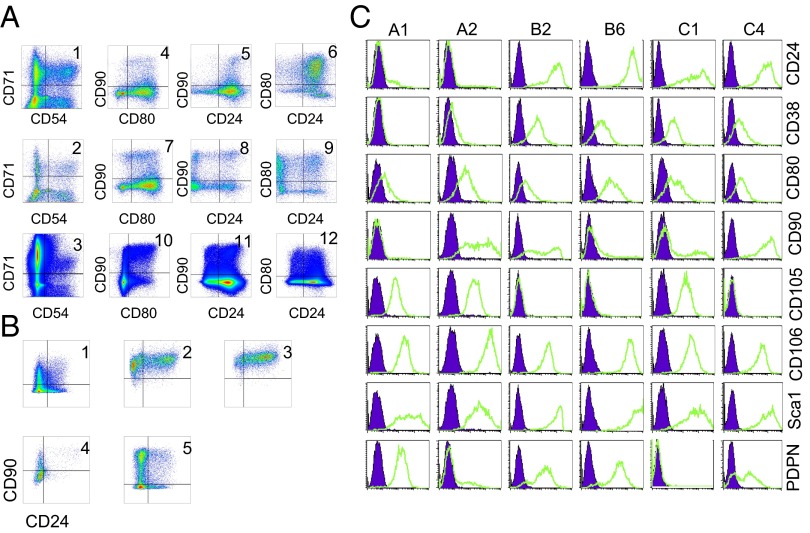
Fig. 2.
Heterogeneity within fibroblast-like cells. (A) Subset analyses. First column (1–3), CD71 and CD54 subsets; subsequent columns, analysis of the CD71+ CD54− subset by CD24, CD80, and CD90. Top row (1, 4, 5, 6), CD146+ CD73+ population; middle row (2, 7, 8, 9), CD146− CD73+ population; bottom row (3, 10, 11, 12), CD146+ CD73− population. (B) Stability of surface phenotype. Cultures initiated from subpopulations were reanalyzed after propagation in culture for four to six passages. Top row (1–3), reanalysis of CD54− CD73− Sca+ CD80− cells that were originally CD24− CD90− (1), CD24− CD90+ (2), or CD24+ CD90+ (3). Bottom row (4 and 5), CD54− CD73− Sca+ CD80+ cells, originally CD24− CD90− (4) or CD24− CD90+ (5). (C) Heterogeneity of cell populations derived from isolated colonies. Individual colonies were picked and expanded, and the surface expression patterns of the progeny were analyzed by flow cytometry.

