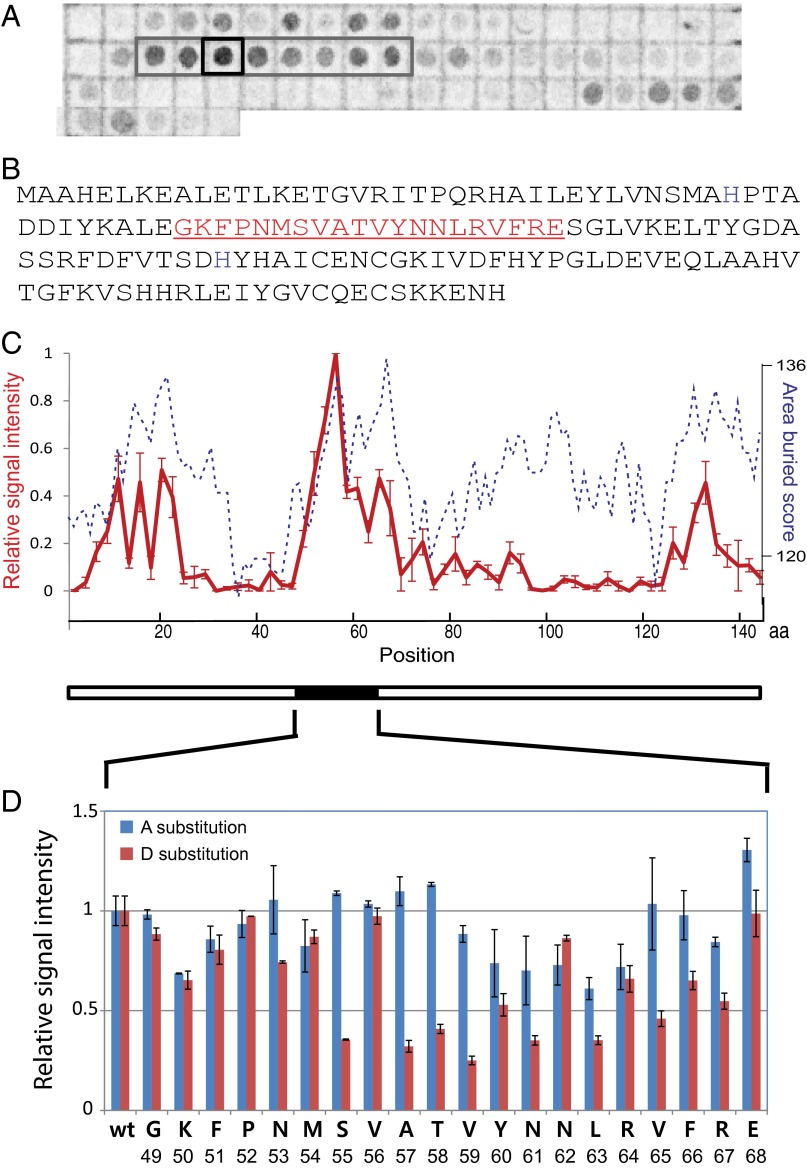
Fig. 4.
A region of the PerR polypeptide strongly interacts with LonA. (A) Membranes displaying spots of specific peptides from PerR were used to determine LonA-interacting region(s). Spots are composed of 20-amino-acid peptides from across the entire PerR sequence, and peptides were incubated with radioactive (S35-Met labeled) LonA. The gray box indicates a region of high signal intensity, and the black square indicates the spot with the strongest signal. The blot presented here is representative of three independent experiments. (B) Amino acid sequence of PerR. The peptide sequence of the spot that showed the strongest interaction signal with LonA (the black square in A) is indicated in red. (C) Relative interaction affinities of Lon to each PerR peptide fragment presented in A (red solid line, left y axis, scaled as the relative radioactive signal intensities of spots with ±1 SEM) was compared with calculated surface-burial scores of corresponding peptides (blue dashed line, right y axis; Materials and Methods). The x axis displays amino acid positions in PerR sequence. (D) Relative intensity of radioactive signals of Ala (blue bars) or Asp (red bars) substitution in individual positions. Data are plotted as average values of three independent experiments with ±1 SEM.

