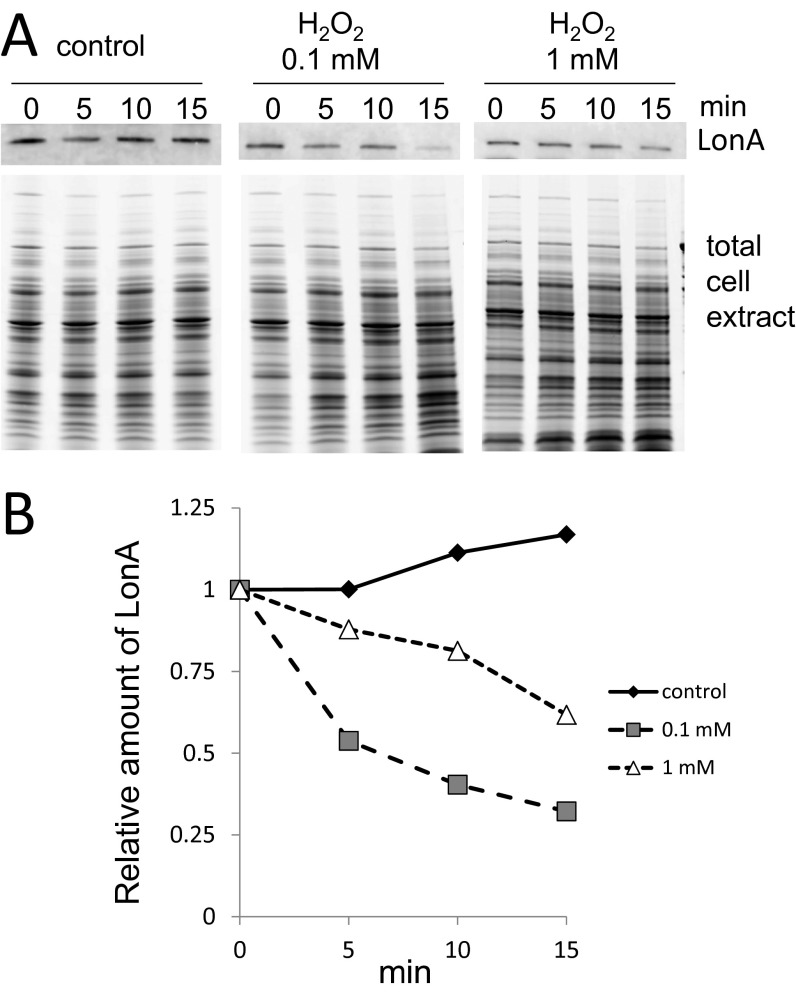
Fig. S1.
LonA expression level in the presence of H2O2. (A) Time-based observation of LonA protein levels in the absence or presence of H2O2. A concentration of 100 µM (0.1 mM) or 1 mM H2O2 was added in the LB medium when the cell density was 0.6 at OD600. LonA protein level was detected by immunoblot. (B) Relative amount of LonA calculated from immunoblot signal intensity and the total protein content of cell extract in A.

