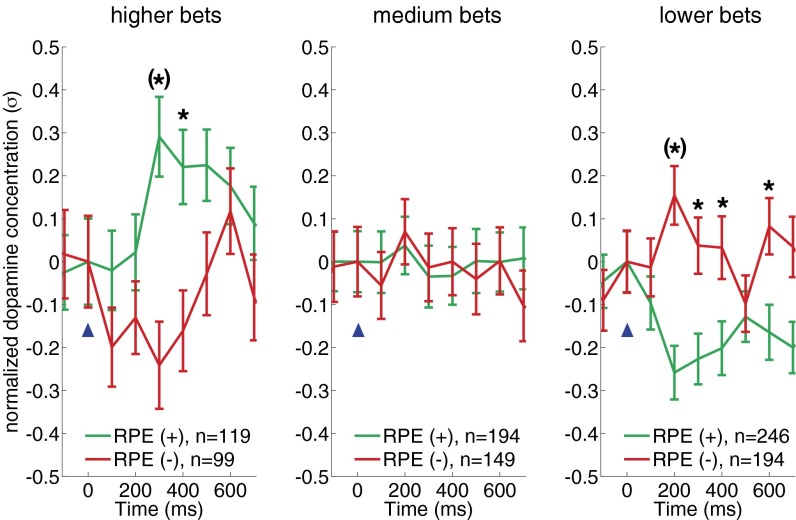
Fig. 4.
RPE encoding by dopamine transients invert as a function of bet size. Dopamine responses to equal absolute magnitude positive and negative RPEs (−0.75 > RPE > +0.75) when bets are high (higher bets, 100–90%) (Left), medium (medium bets, 80–60%) (Center), or low (lower bets, 50–10%) (Right). For all three plots, mean normalized dopamine responses (±SEM) to positive RPEs (green traces) and negative RPEs (red traces). Inset legends show sample sizes for event types. Two-way ANOVA (RPE-sign and time: 700 ms following and including outcome reveal) reveals a significant difference comparing dopamine responses for positive and negative RPEs following higher bets [FRPE-sign(1,7) = 21.17, P = 0.00] and lower bets [FRPE-sign(1,7) = 32.64, P = 0.00] but not medium bet sizes [FRPE-sign(1,7) = 0.15, P = 0.6957]. Asterisks indicate significant difference between red and green traces: P < 0.05, post hoc, two-sample t test following ANOVA with time and RPE-sign as the two main factors. Asterisks with parentheses indicate Bonferroni correction for multiple comparisons. For low bets (i.e., large CPEs), only those events where the market price change and the RPE-sign are the same are considered. Horizontal axis: time (ms) from outcome reveal (blue arrowhead); vertical axis: mean change in normalized dopamine response.

