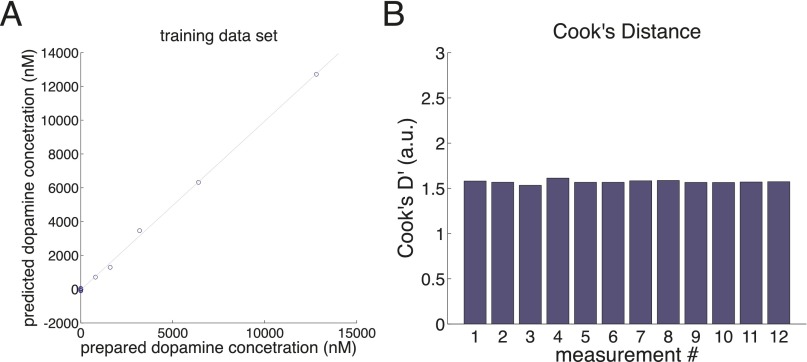
Fig. S2.
Cook’s distance analysis of training dataset. (A) Loadings of the 12 training data background-subtracted voltammograms on to the seven principal components are used to fit a linear regression by ordinary least squares. (B) Cook’s distances are calculated for each training data measurement to test for outliers in the training dataset.

