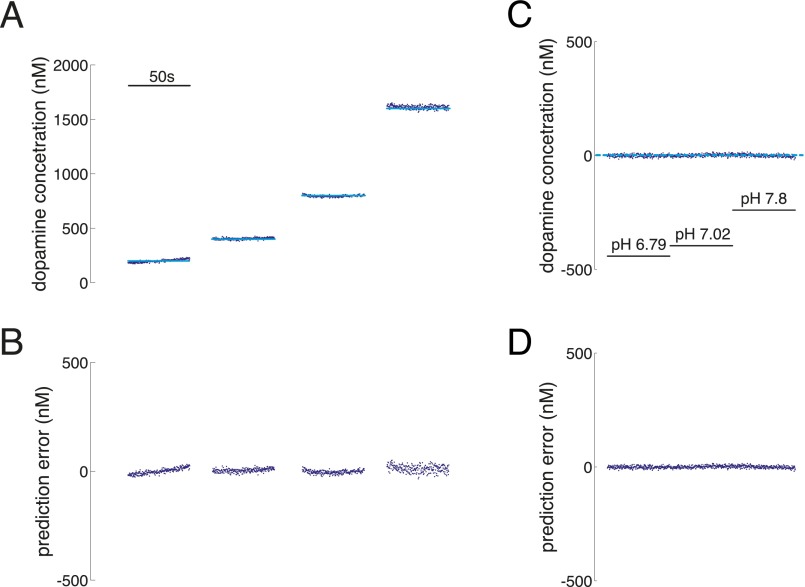
Fig. S4.
Performance of EN-based approach on out-of-sample test cases. (A and B) Changes in dopamine concentration under stable pH (pH 7.4). (C and D) Changes in pH under stable dopamine concentration (dopamine concentration for C and D is 0). (A) Prepared dopamine concentration (light blue: 200, 400, 800, and 1,600 nM) compared with the EN-based predictions for dopamine concentration (dark blue). The inset scale bar indicates measurement period of 50 s. (B) Prediction error of EN-based predictions of dopamine concentration over the range of dopamine concentrations shown in A. (C) Predictions of dopamine concentration when pH is changed but dopamine concentration is held constant (0). Dotted light blue line indicates actual concentration of dopamine is equal to 0. Insets indicate pH levels (pH range: 6.79, 7.02, 7.8). (D) Prediction error of EN-based predictions of dopamine concentration over the range of pH fluctuations shown in C.

