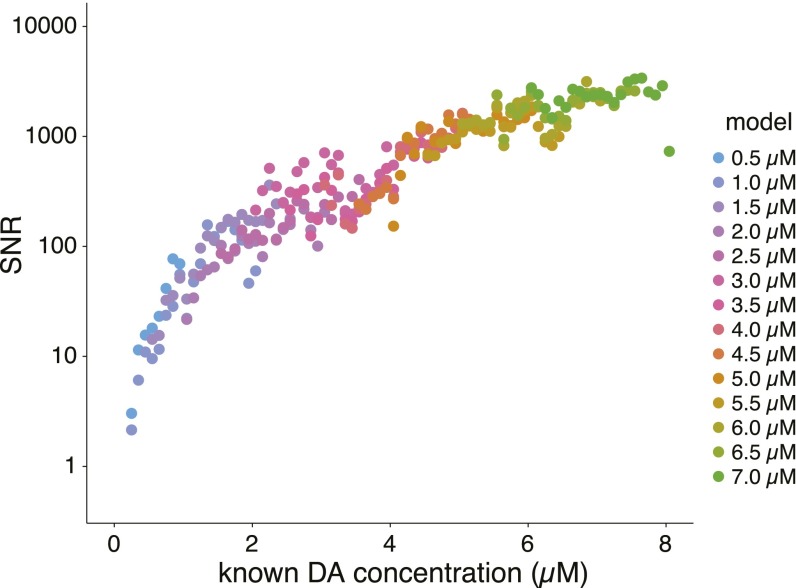
Fig. S5.
SNR of EN-based dopamine estimation as a function of dopamine concentration. Horizontal axis: concentration of prepared dopamine; vertical axis: SNR. Colored points indicate the value of the characteristic parameter (mean concentration of the training data) for each model generated (see inset legend for values).

