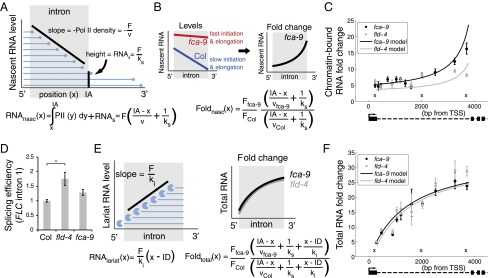
Fig. 3.
Combination of increased initiation and elongation, with cotranscriptional splicing and lariat degradation, leads to distinct RNA profiles along FLC intron1. (A) Schematic indicating intronic nascent RNA, RNAnasc (blue lines), arising from Pol II (blue circles) elongating through the intron and from unspliced RNAs with full-length intron. Once Pol II has passed the intron acceptor site (IA), splicing can occur. Initiation, elongation, and splicing rates are F, v, and ks, respectively. Analytic expression for RNAnasc is shown below. (B) Schematic (Left) indicating model profiles of nascent RNA along FLC intron1 in fca-9 and Col. Between fca-9 and Col, F and v are coordinately increased, but with the same ks. This generates a characteristic pattern of intronic nascent RNA fold changes between fca-9 and Col (Right) with analytic expression shown. (C) Modeled and experimentally measured chromatin-bound RNA fold changes along FLC intron1. The lower increase toward the 3′ end in fld-4 is due to increased splicing rate as shown experimentally in D. Crosses indicate positions where data are from three different, overlapping primer sets that each show similar results (Fig. S4). (D) Estimate of FLC intron1 splicing efficiency (intron cleavage rate) in fld-4 and fca-9, normalized to the level in Col. Values are mean ± SEM from three independent samples. Asterisks indicate statistical significance: for all of the figures in this study, *P < 0.05, **P < 0.01, ***P < 0.001, two-sided unpaired t test, unless specified otherwise. (E) Schematic showing effect of 5′ to 3′ intronic RNA degradation on lariat RNA levels (RNAlariat). Full-length lariat RNA results from splicing and is degraded with rate ki; ID: intron donor site. These degradation intermediates, together with the nascent RNA described in A, make up total intronic RNA. Fold up-regulation then generates the characteristic profiles shown. Analytic expressions for RNAlariat and total intronic RNA fold changes are shown. (F) Modeled and experimentally measured total RNA fold changes along FLC intron1. (C and F) Experimental values are mean ± SEM from at least three independent samples. Absolute levels are shown in Fig. S4.

