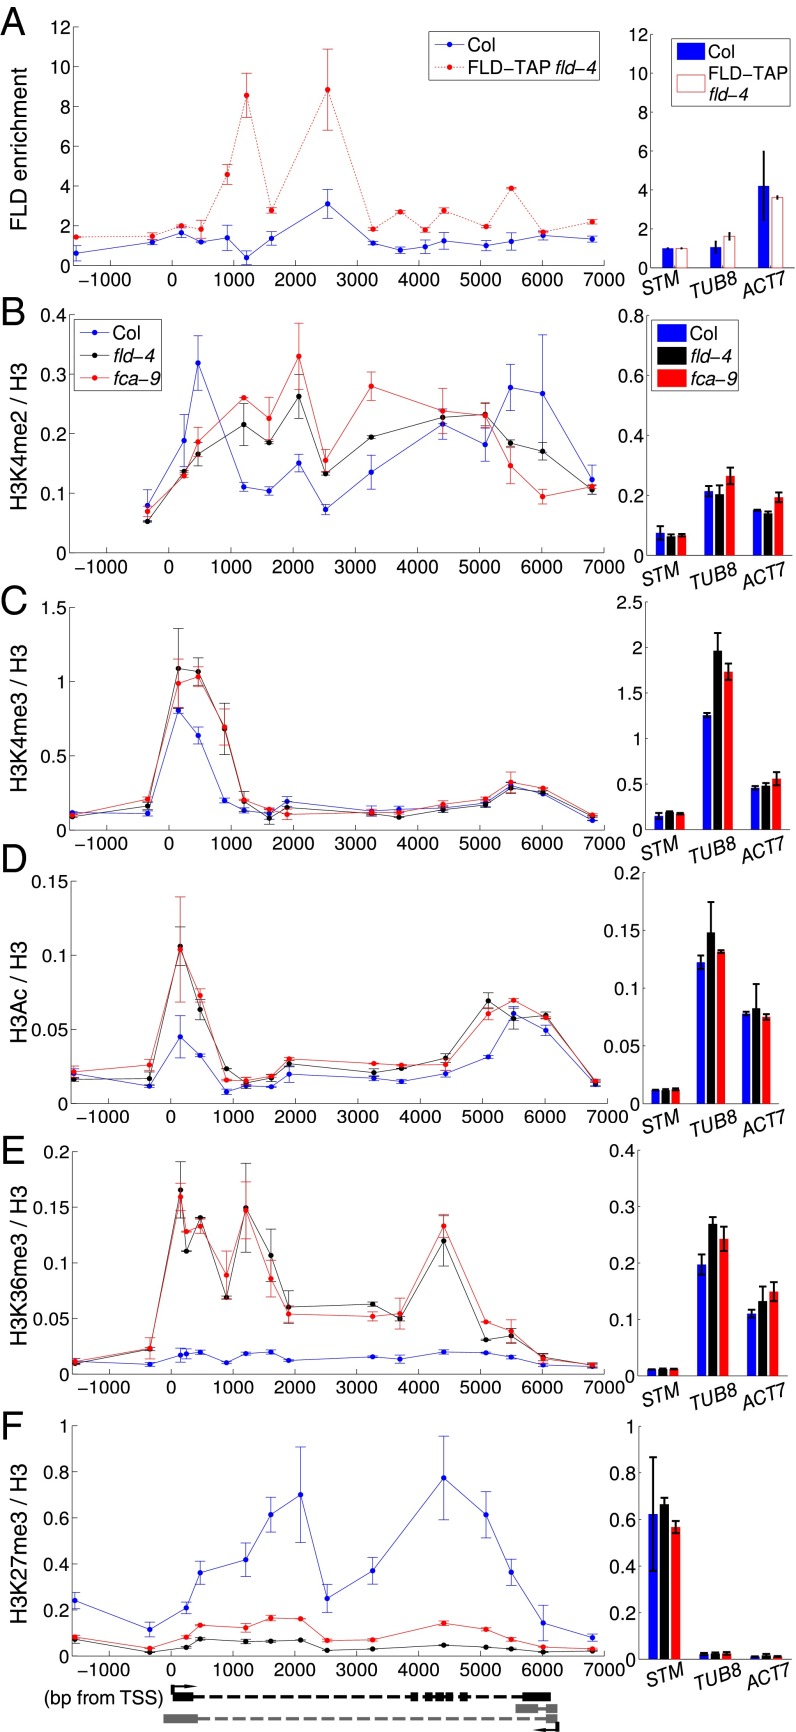
Fig. 4.
FLD enrichment at the FLC locus is associated with changed histone modifications. (A) FLD-TAP ChIP enrichment across FLC in Col and FLD-TAP/fld-4. Values are mean ± SEM from two independent samples, with data presented as enrichment at FLC relative to enrichment at STM. (B–F) ChIP across FLC in Col, fca-9 and fld-4 measuring H3K4me2 (B), H3K4me3 (C), H3Ac (D), H3K36me3 (E), and H3K27me3 (F). Values are mean ± SEM from two independent samples, with data normalized to H3. Values at the control genes STM, ACT7, and TUB8 are shown on the Right. H3/input values can be found in Fig. S7.

