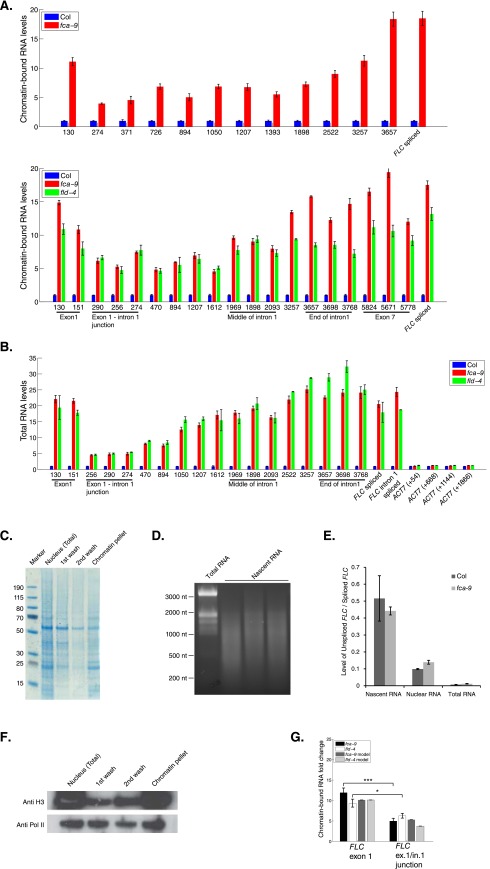
Fig. S4.
Intronic RNA levels increase gradually along FLC intron1 (related to Fig. 3). (A) Chromatin-bound RNA levels in fca-9, fld-4, and Col, along FLC intron1. (B) Total RNA levels in fca-9, fld-4, and Col along FLC intron1. Primers along Actin7 were checked as a control. (A and B) Experimental values are mean ± SEM from three independent samples. (C) Proteins in different fractions obtained during chromatin-bound RNA preparation. Same volume from each fraction was loaded and separated in 4–20% gradient NuPAGE gel and stained with Coomassie blue. (D) The size distribution of chromatin-bound RNA. No obvious band of ribosomal RNA was detected. (E) Enrichment of unspliced FLC (intron2 and intron3 unspliced) over spliced FLC (intron4, intron5, and intron6 spliced) in total, nuclear, and chromatin-bound RNA fractions. Values are mean ± SD from three independent samples. (F) Majority of Pol II (8WG16) and H3 was preserved in the chromatin fraction. Different fractions obtained during chromatin-bound RNA preparation were gel separated (as in C), followed by Western blot detection of Pol II and H3. (G) Model and experimentally measured chromatin-bound RNA fold up-regulation in fca-9 and fld-4 compared with Col at FLC exon1 and exon1–intron1 junctions. The related mathematical analysis can be found in Computational Modeling.

