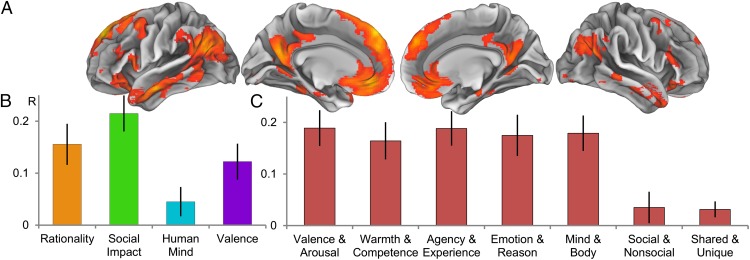
Fig. 3.
Network-wide representational similarity analysis. (A) Whole brain ANOVA used for feature selection (voxelwise P < 0.0001). Different mental states reliably elicited different levels of univariate activity within these regions. (B) Bar graphs of model fits for dimensions derived via principal component analysis from existing psychological theories. (C) Bar graphs of model fits for existing psychological models. All model fits are given in terms of Pearson product-moment correlations between neural pattern similarity and model predictions, with error bars indicating bootstrapped SEs. Note that bars in B refer to individual dimensions derived via PCA whereas bars in C indicate the performance of full multidimensional theories. The theoretical advantage of the synthetic model presented here can thus be seen by comparing any one bar in C with the combination of the three significant bars in B.

