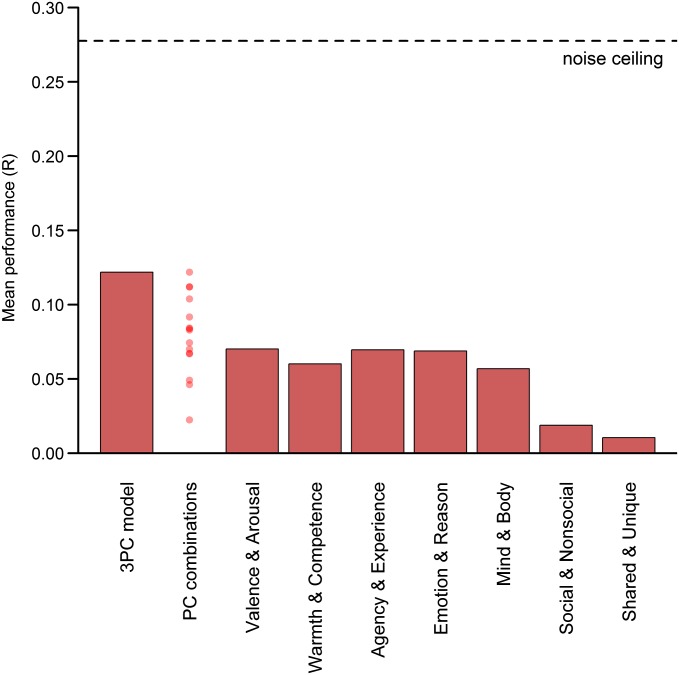
Fig. S3.
Cross-validated model performance. Bars indicate performance of a representation similarity analysis based on nonnegative least-squares regression. Weights for dimensions within each theory were trained on data from 19 participants. This regression model was then tested by predicting the neural pattern similarity of the left-out participant. Each participant was left out iteratively, and results were averaged across all 20 training-testing combinations. Points in the “PC combinations” column indicate the performance of every possible combination of 1–4 of the 4 PCs. The farthest left bar indicates the performance of the best model, consisting of the PCs rationality, social impact, and valence. The noise ceiling indicates the expected performance of an ideal model for mental state representation.

