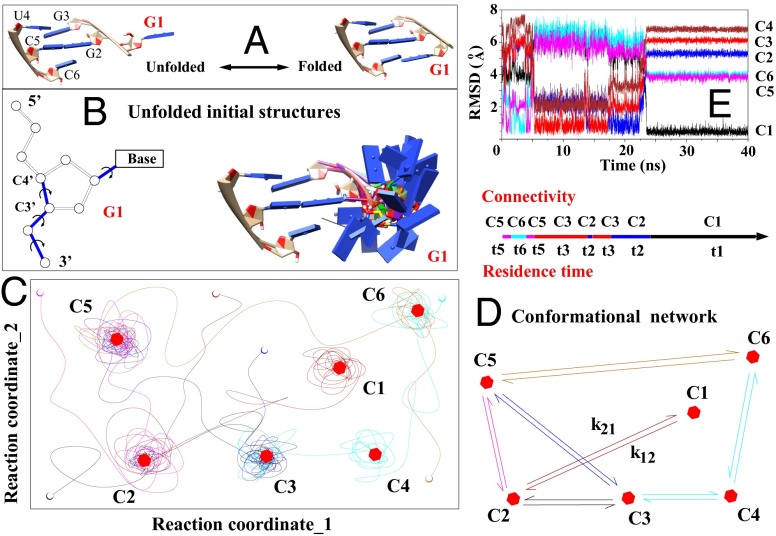
Fig. 1.
(A) Folding of a single nucleotide (G1, red) from the unfolded (Left) to the native folded (Right) state. (B) Exhaustive sampling for the (discrete) conformations of the G1 nucleotide (Right) through enumeration of the torsion angles (formed by the blue bonds). (C) Schematic plot shows the trajectories on the energy landscape (depicted with two reaction coordinates for clarity) explored by the MD simulations. The lines, open circles, and hexagons denote the trajectories; the initial states; and the (centroid structures of the) clusters, respectively. (D) Conformational network based on six clusters. (E) The rmsds to the different clusters provide information about the structural changes in a MD trajectory.

