Fig. 3.
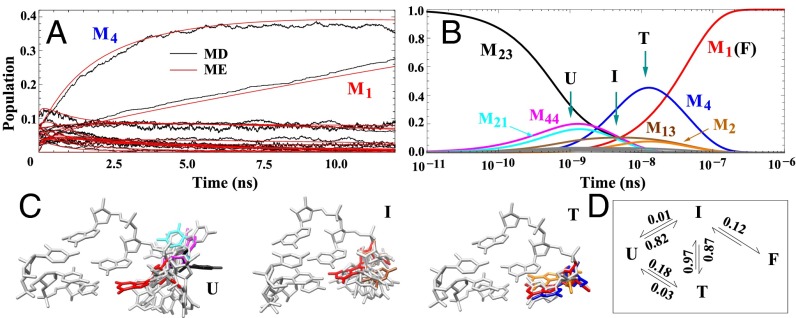
(A) Comparison between the kinetics results from MD simulations and from the ME method (red). The ME method is based on the 50-cluster conformational network. As shown in Fig. 1E, we bin the MD snapshots according to the 50 clusters to obtain the time-dependent populations for each cluster from MD (shown in black). The results support the validity of the 50-cluster network model. (B) ME-predicted, long-time, single-nucleotide folding kinetics starting from the unfolded cluster M23 (black line). Based on the behavior of the populational kinetics for each cluster, we classify the 50 clusters into four states: unfolded (U), intermediate (I), trapped (T), and folded (F). (C) Typical structures of the three states are shown, with the folded state (F, in red) included for comparison. Structures of the clusters with significant populations in B are shown in C with the same color code. (D) Four-state scheme for the single-nucleotide kinetics. The numbers indicate the probabilities of the transitions between the states, (e.g., 0.87 for I → T, 0.01 for I → U, and 0.12 for I → F).

