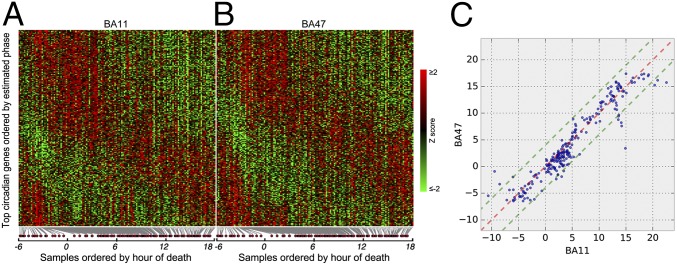
Fig. 1.
Heat map of expression levels and comparison of circadian acrophase for the top circadian genes (n = 235, q < 0.05) in BA11 and BA47. (A and B) Expression levels were Z-transformed for each gene. Red indicates higher expression level; green indicates lower expression levels. (C) The circadian phase (peak hours) of 235 circa genes derived from metaanalysis are plotted on TOD axes for BA11 (x axis) and BA47 (y axis). Red dashed line: 1:1 diagonal line. Green dashed lines: ±4-h phase concordance boundaries. Ninety-two percent of circa genes (217 of 235) are located within the concordance interval.

