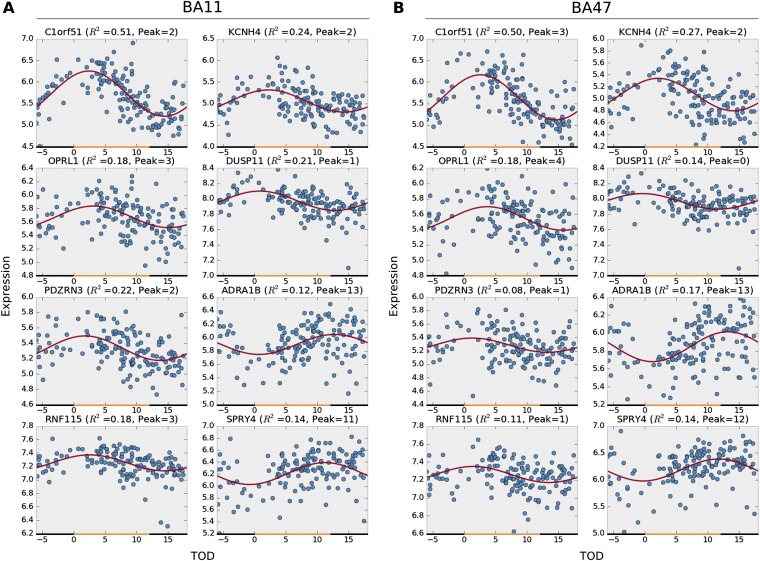
Fig. S2.
Top eight rhythmic genes in BA11 (A) and BA47 (B). The x axis denotes the time of death (TOD) on ZT scale (−6–18 h). Approximate day–night interval within a pseudoday is represented by yellow (day) and black (night) bands. Data points from 146 subjects are plotted in blue. The best-fitted sinusoidal curves are depicted in red. The empirical P value and the estimated peak hour are also reported above each panel.

