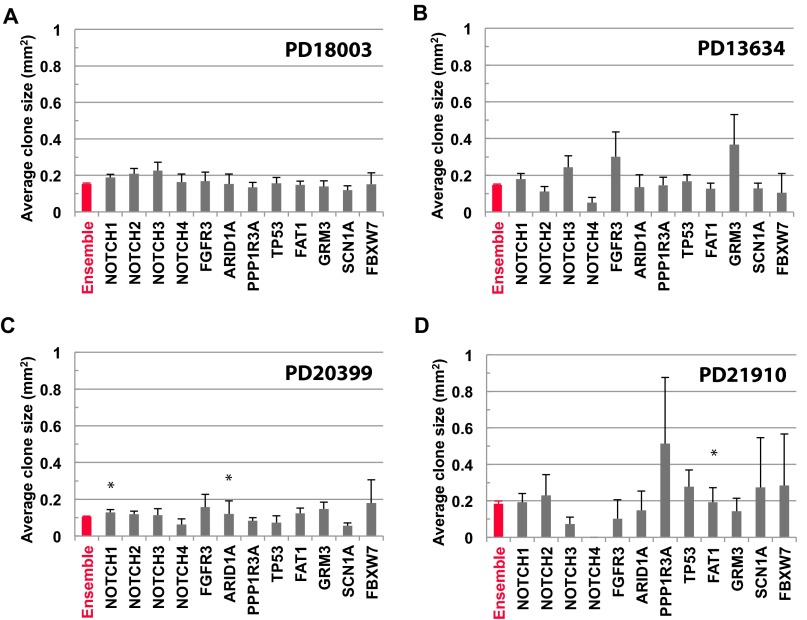
Fig. S7.
Average clone size for typical driver genes is consistent with neutral dynamics. Average size of mutant clones belonging to different cancer drivers (black) compared by the ensemble average of all genes (red) for patients (A) PD18003, (B) PD13634, (C) PD20399, and (D) PD21910. Note that, for the majority of genes and patients, the departure of the average clone size for cancer drivers from the ensemble average is not statistically significant. Error bars denote SEM. To test for inequivalence of specific genes from the ensemble average, we have used a Kolmogorov–Smirnov test to compare mutant clone size distributions. The P values from the four patients, PD18003, PD13634, PD20399, and PD21910 are, respectively, given by NOTCH1: 0.050, 0.18, 0.025, and 0.25; NOTCH2: 0.081, 0.31, 0.97, and 0.25; NOTCH3: 0.34, 0.15, 0.66, and 0.19; NOTCH4: 0.43, 0.14, 0.99, and not available (N/A); FGFR3: 0.16, 0.54, 0.012, and N/A; ARID1A: 0.51, 0.81, 0.043, and 0.92; PPP1R3A: 1.00, 0.17, 0.27, and 0.072; TP53: 0.53, 0.06, 0.33, and 0.37; FAT1: 0.46, 0.96, 0.92, and 0.044; GRM3: 0.95, 0.18, 0.64, and 0.92; SCN1A: 0.51, 0.65, 0.078, and N/A; and FBXW7: 0.84, N/A, 0.65, and N/A. These results show that, for all but three entries, the statistical equivalence of the distributions cannot be ruled out (at a significance level of 0.05).

