Fig. 1.
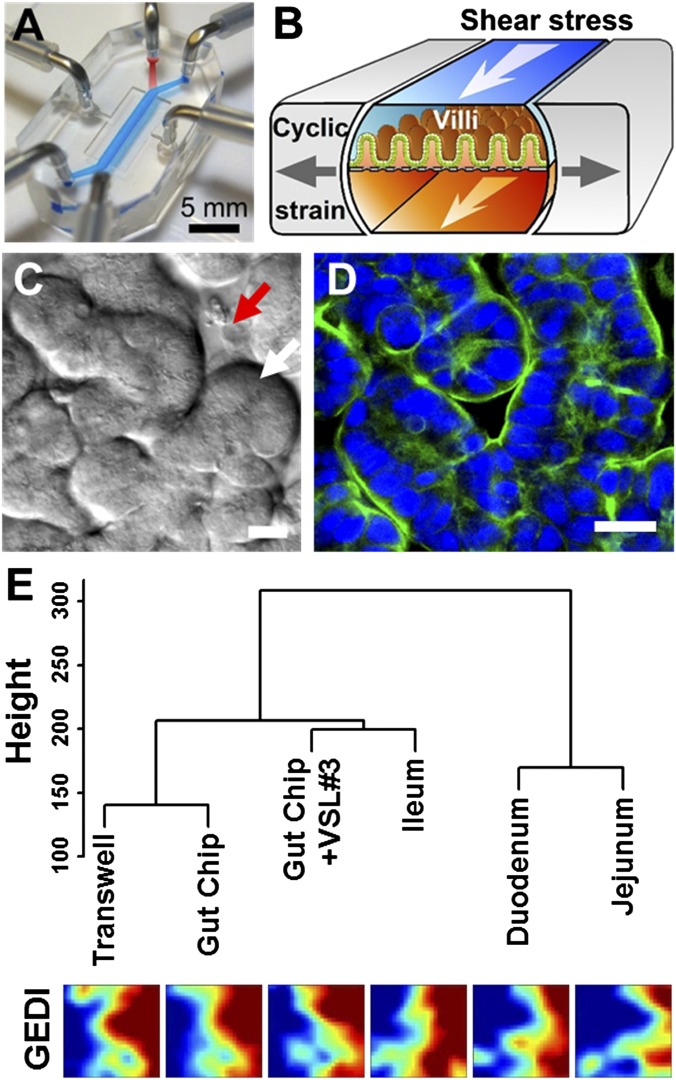
The human gut-on-a-chip microfluidic device and changes in phenotype resulting from different culture conditions on-chip, as measured using genome-wide gene profiling. (A) A photograph of the device. Blue and red dyes fill the upper and lower microchannels, respectively. (B) A schematic of a 3D cross-section of the device showing how repeated suction to side channels (gray arrows) exerts peristalsis-like cyclic mechanical strain and fluid flow (white arrows) generates a shear stress in the perpendicular direction. (C) A DIC micrograph showing intestinal basal crypt (red arrow) and villi (white arrow) formed by human Caco-2 intestinal epithelial cells grown for ∼100 h in the gut-on-a-chip under medium flow (30 µL/h) and cyclic mechanical stretching (10%, 0.15 Hz). (Scale bar, 50 µm.) (D) A confocal immunofluorescence image showing a horizontal cross-section of intestinal villi similar to those shown in Fig. 1C, stained for F-actin (green) that labels the apical brush border of these polarized intestinal epithelial cells (nuclei in blue). (Scale bar, 50 µm.) (E) Hierarchical clustering analysis of genome-wide transcriptome profiles (Top) of Caco-2 cells cultured in the static Transwell, the gut-on-a-chip (with fluid flow at 30 µL/h and mechanical deformations at 10%, 0.15 Hz) (Gut Chip), or the mechanically active gut-on-a-chip cocultured with the VSL#3 formulation containing eight probiotic gut microbes (Gut Chip + VSL#3) for 72 h compared with normal human small intestinal tissues (Duodenum, Jejunum, and Ileum; microarray data from the published GEO database). The dendrogram was generated based on the averages calculated across all replicates, and all branches in the cluster have the approximately unbiased (AU) P value equal to 100. The y axis next to the dendrogram represents the metric for Euclidean distance between samples. Corresponding pseudocolored GEDI maps analyzing profiles of 650 metagenes between samples described above (Bottom).

