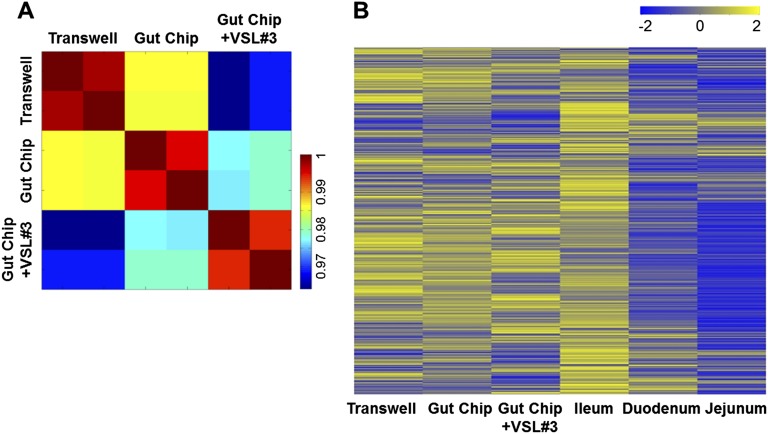
Fig. S1.
Transcriptome profiling of Caco-2 cells grown in various culture conditions and comparison with the normal human small intestinal tissues. (A) Visual representation of a Pearson correlation analysis of pairwise comparisons between transcriptome profiles of Caco-2 cells cultured in the static Transwell, the gut-on-a-chip (Gut Chip) with peristalsis-like fluid flow (30 µL/h) and mechanical deformations (10%, 0.15 Hz), or the mechanically active gut-on-a-chip cocultured with the VSL#3 formulation containing eight probiotic gut microbes (Gut Chip +VSL#3) for 72 h. Each group has two biological replicates, where an individual square in the heat map represents 22,097 human relevant genes (color bar indicates the relative expression levels). (B) Transcriptome hierarchical clustering analysis of genome-wide gene profiles of Caco-2 cells shown in Fig. 1E and Fig. S1A (Transwell, Gut Chip, and Gut Chip +VSL#3) compared with normal human small intestinal tissues (Duodenum, Jejunum, and Ileum; microarray data from the published GEO database). Color bar indicates the z-score scaled gene expression levels.

